Efficient Forest Management
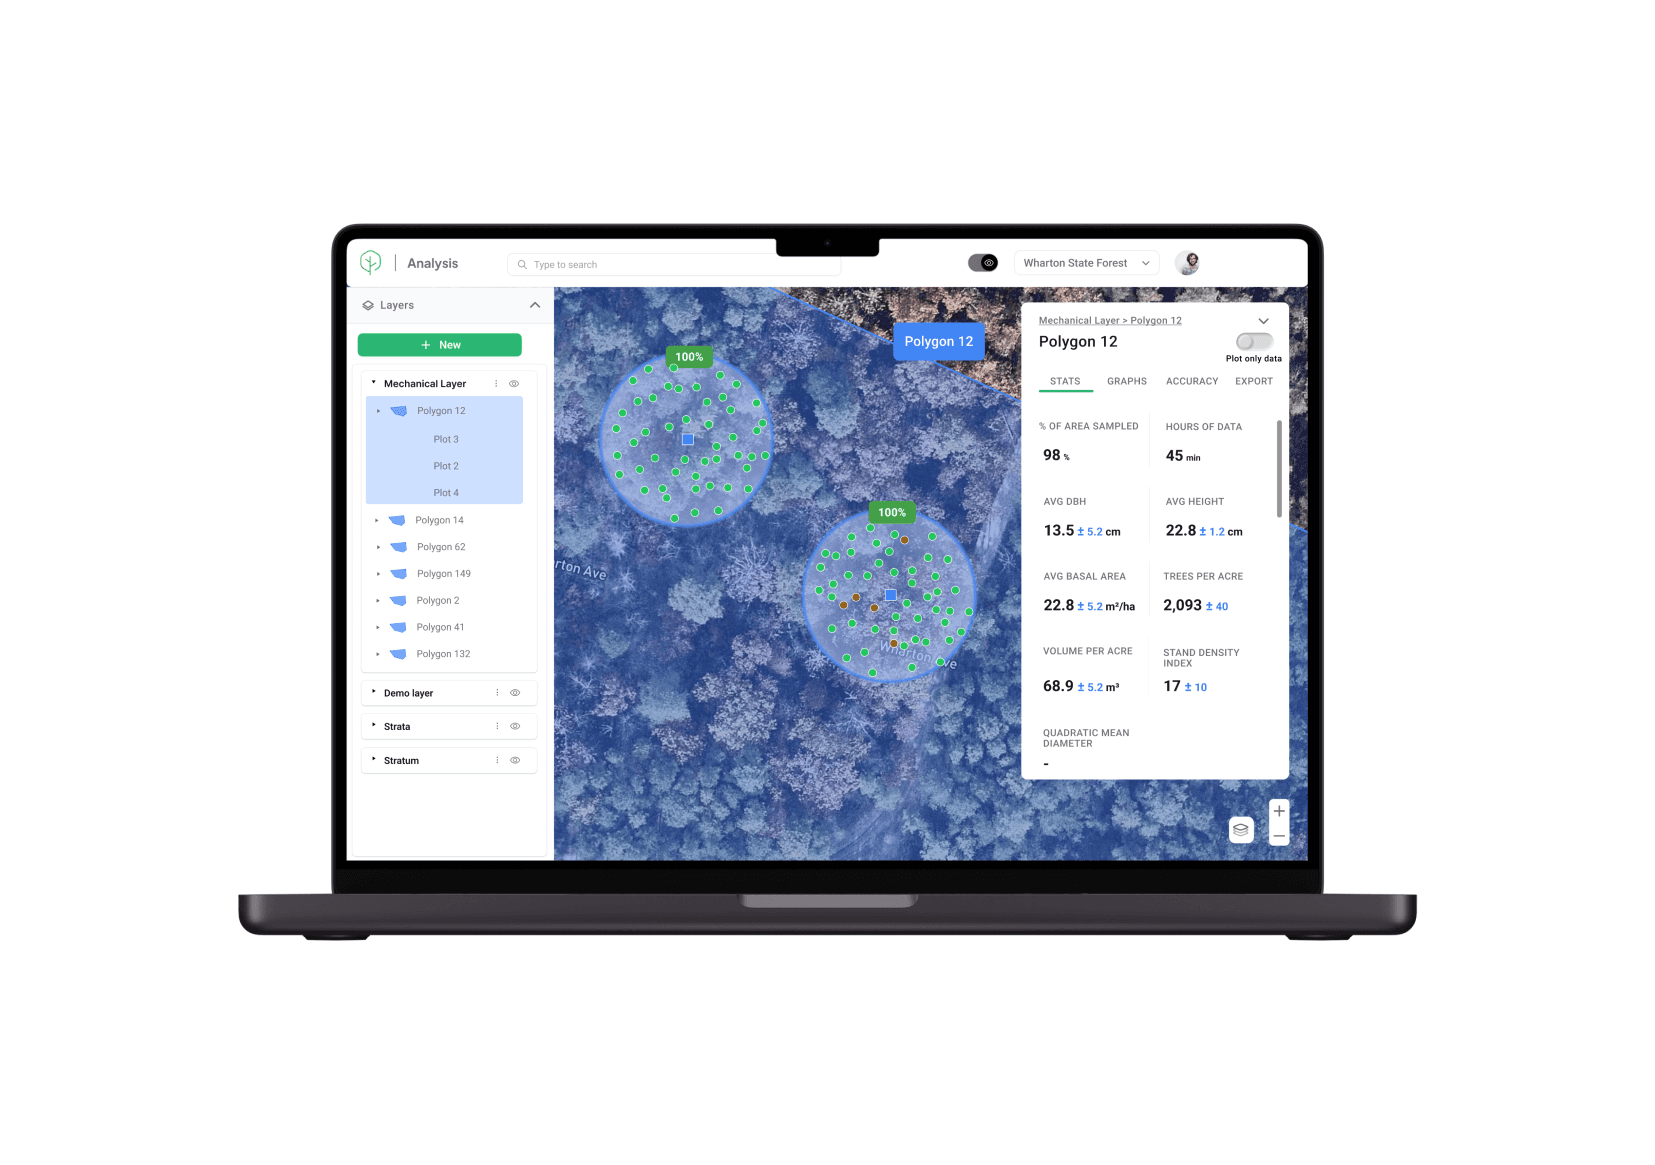
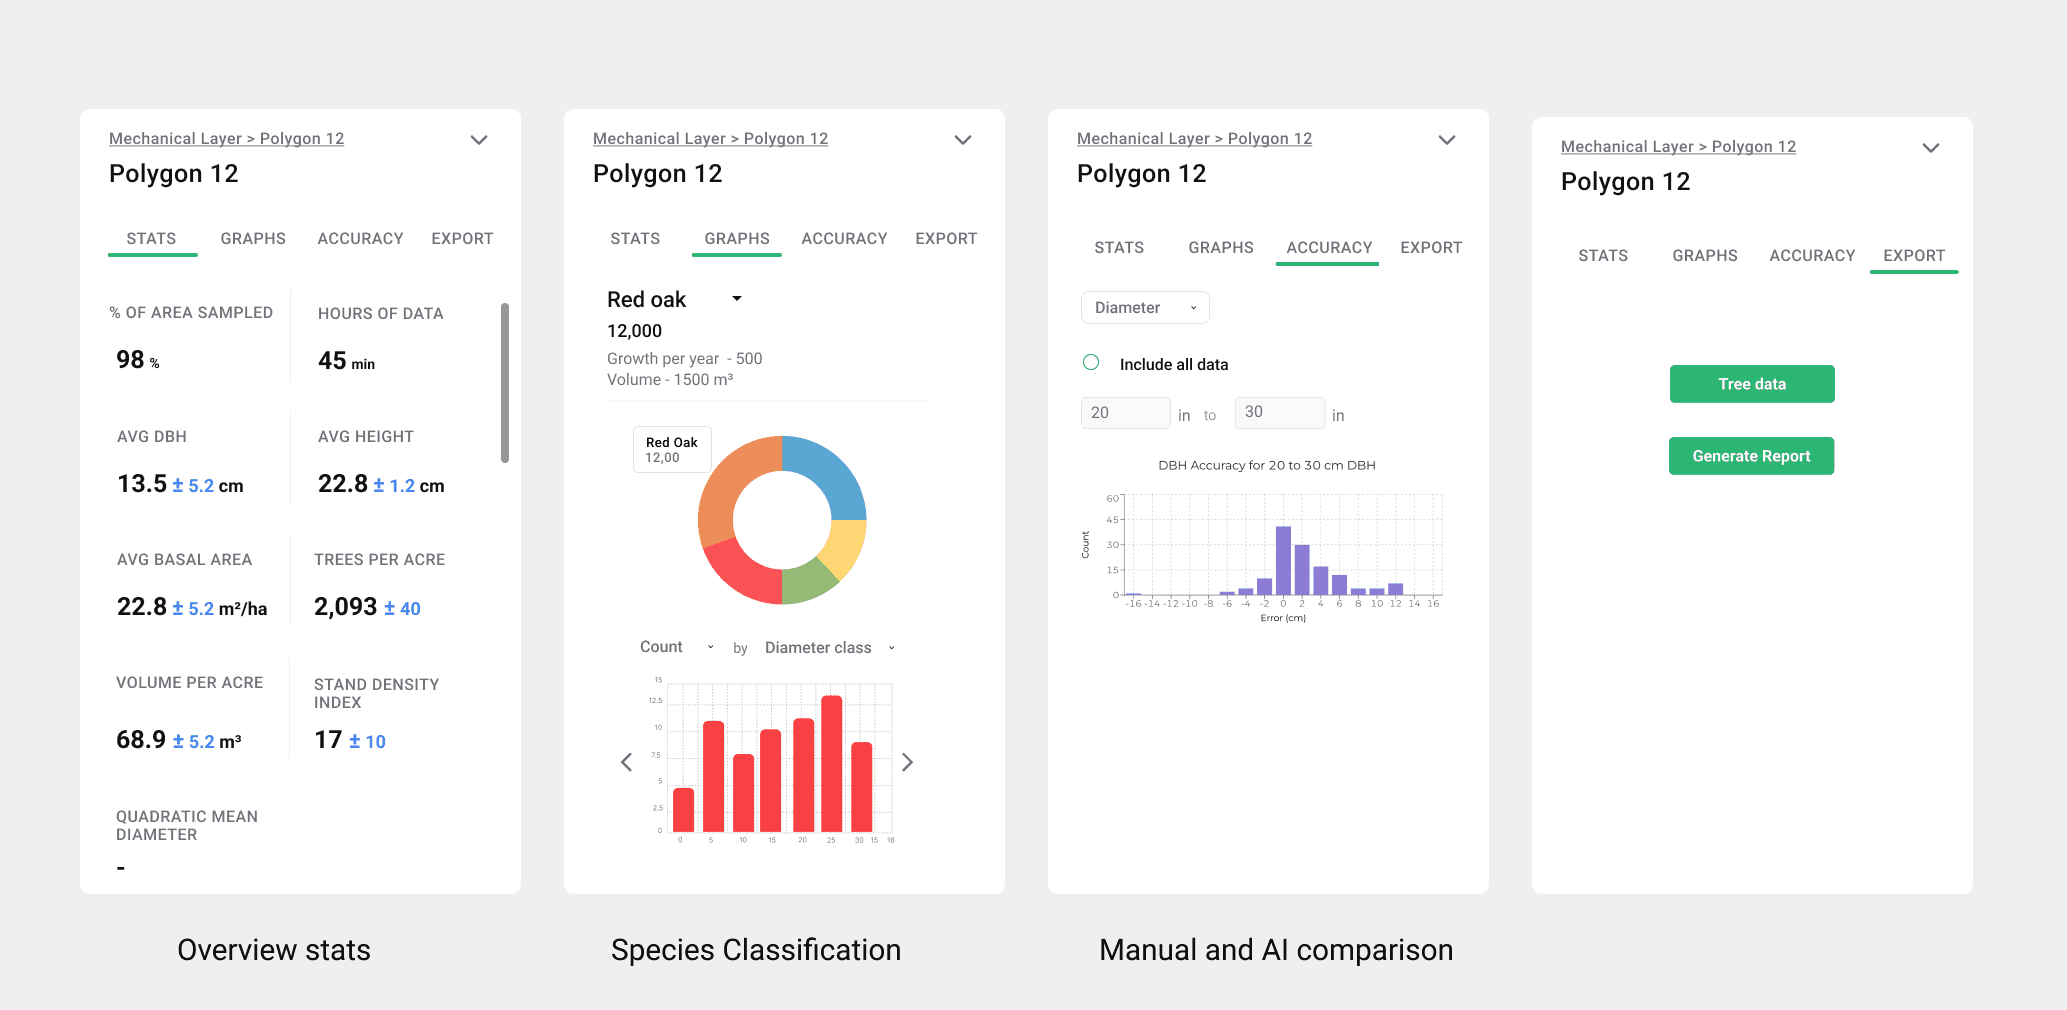
Optimized Gaia’s website design by integrating interactive map visuals and graphs for tree species classification, enhancing management strategies by 25%
Problem Space
Managing and analyzing years of forest data has become increasingly challenging, requiring efficient tools and systems. The need for a comprehensive forestry data organization tool is evident to streamline the process, provide insights, and facilitate informed decision-making for forest managers and conservationists
Outcome
Approach
*For confidentiality reasons, the research aspect cannot be disclosed*
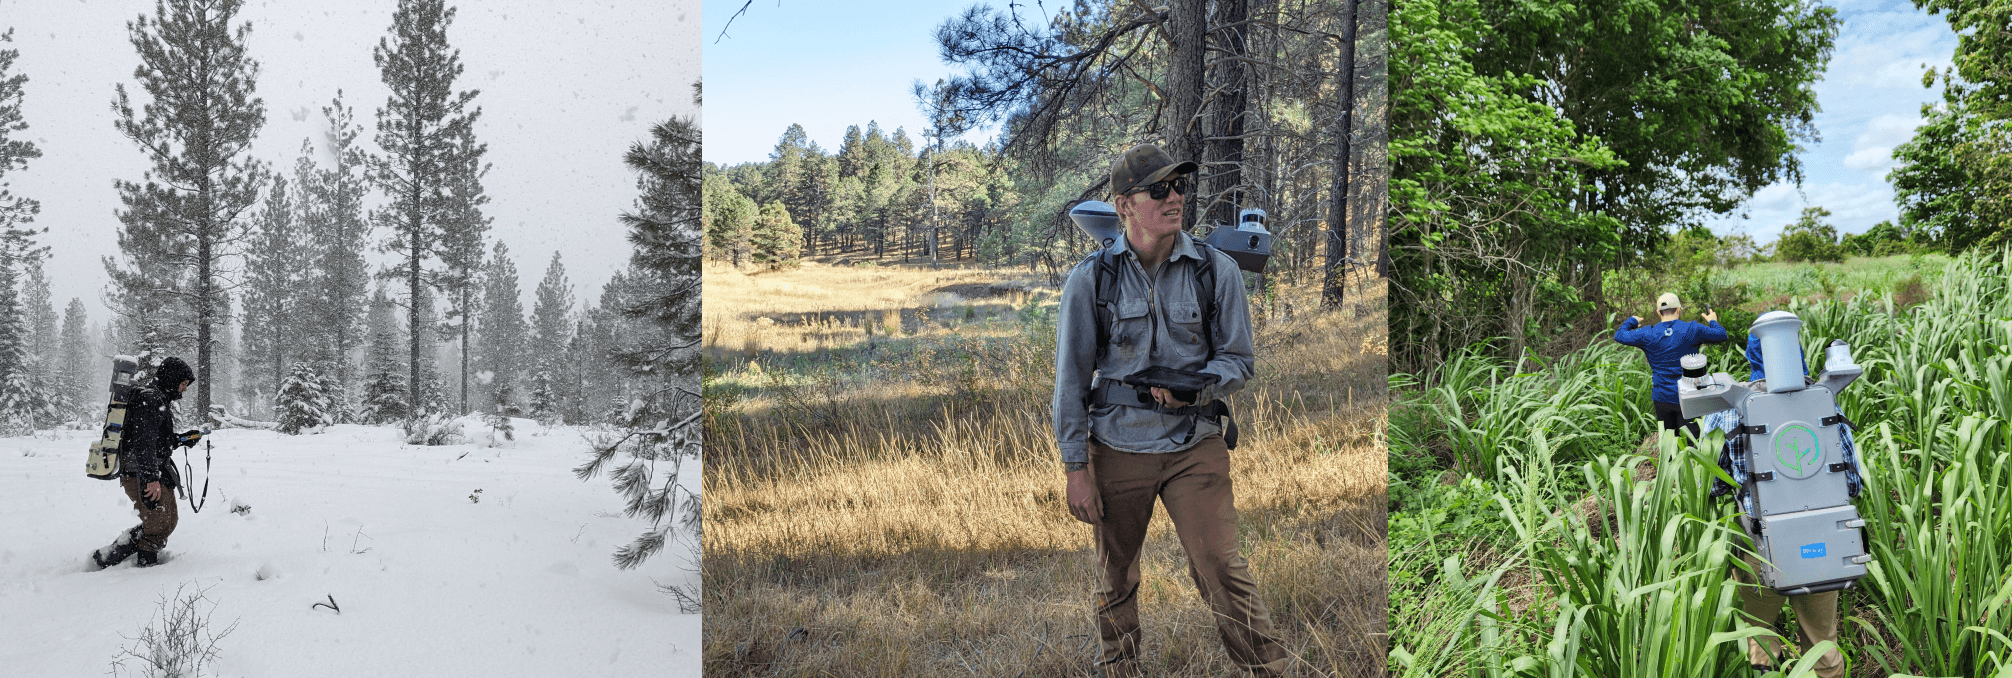
Knowing little to nothing about forestry, I immersed into research and prepared diligently for an upcoming field trip. My aim was to comprehend their specific information organization needs. Armed with a list of questions, I engaged with experts to gather insights into critical data points, visualization preferences, and existing pain points in current solutions. Through these interactions, I found my guiding light, illuminating the path forward in this complex domain
User Interviews
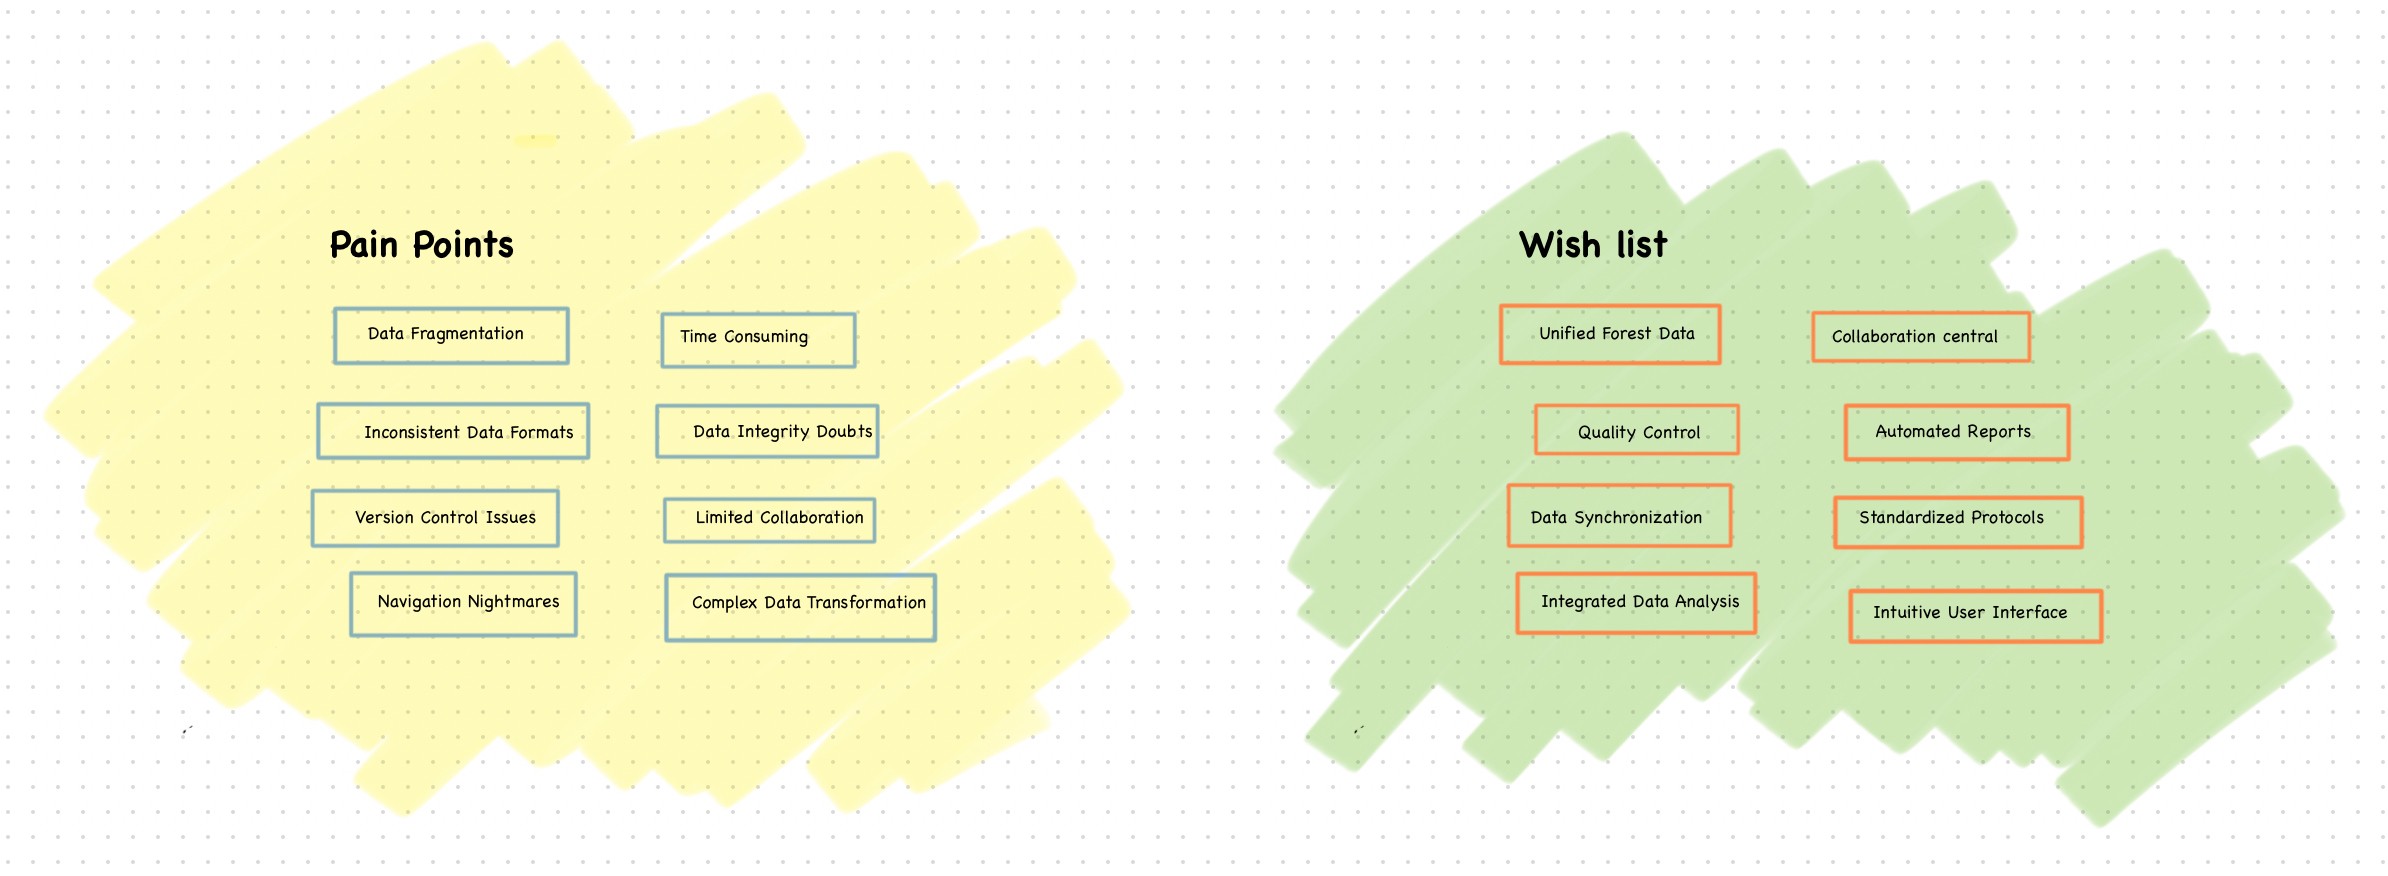
I conducted interviews and surveys with biometricians, stakeholders from various forest management companies to comprehend their specific information organization needs. Insights poured in, revealing the critical data points, visualization preferences, and the pain points in existing solutions. This research became my guiding light, illuminating the path forward.
Initial design discussions are invaluable for facilitating early conversations about design concepts. They help in conveying ideas to stakeholders like the CEO and CFO, who might not be as deeply involved in the design specifics but need to understand the broad strokes for decision-making. For the engineering team, to understand any technical limitations
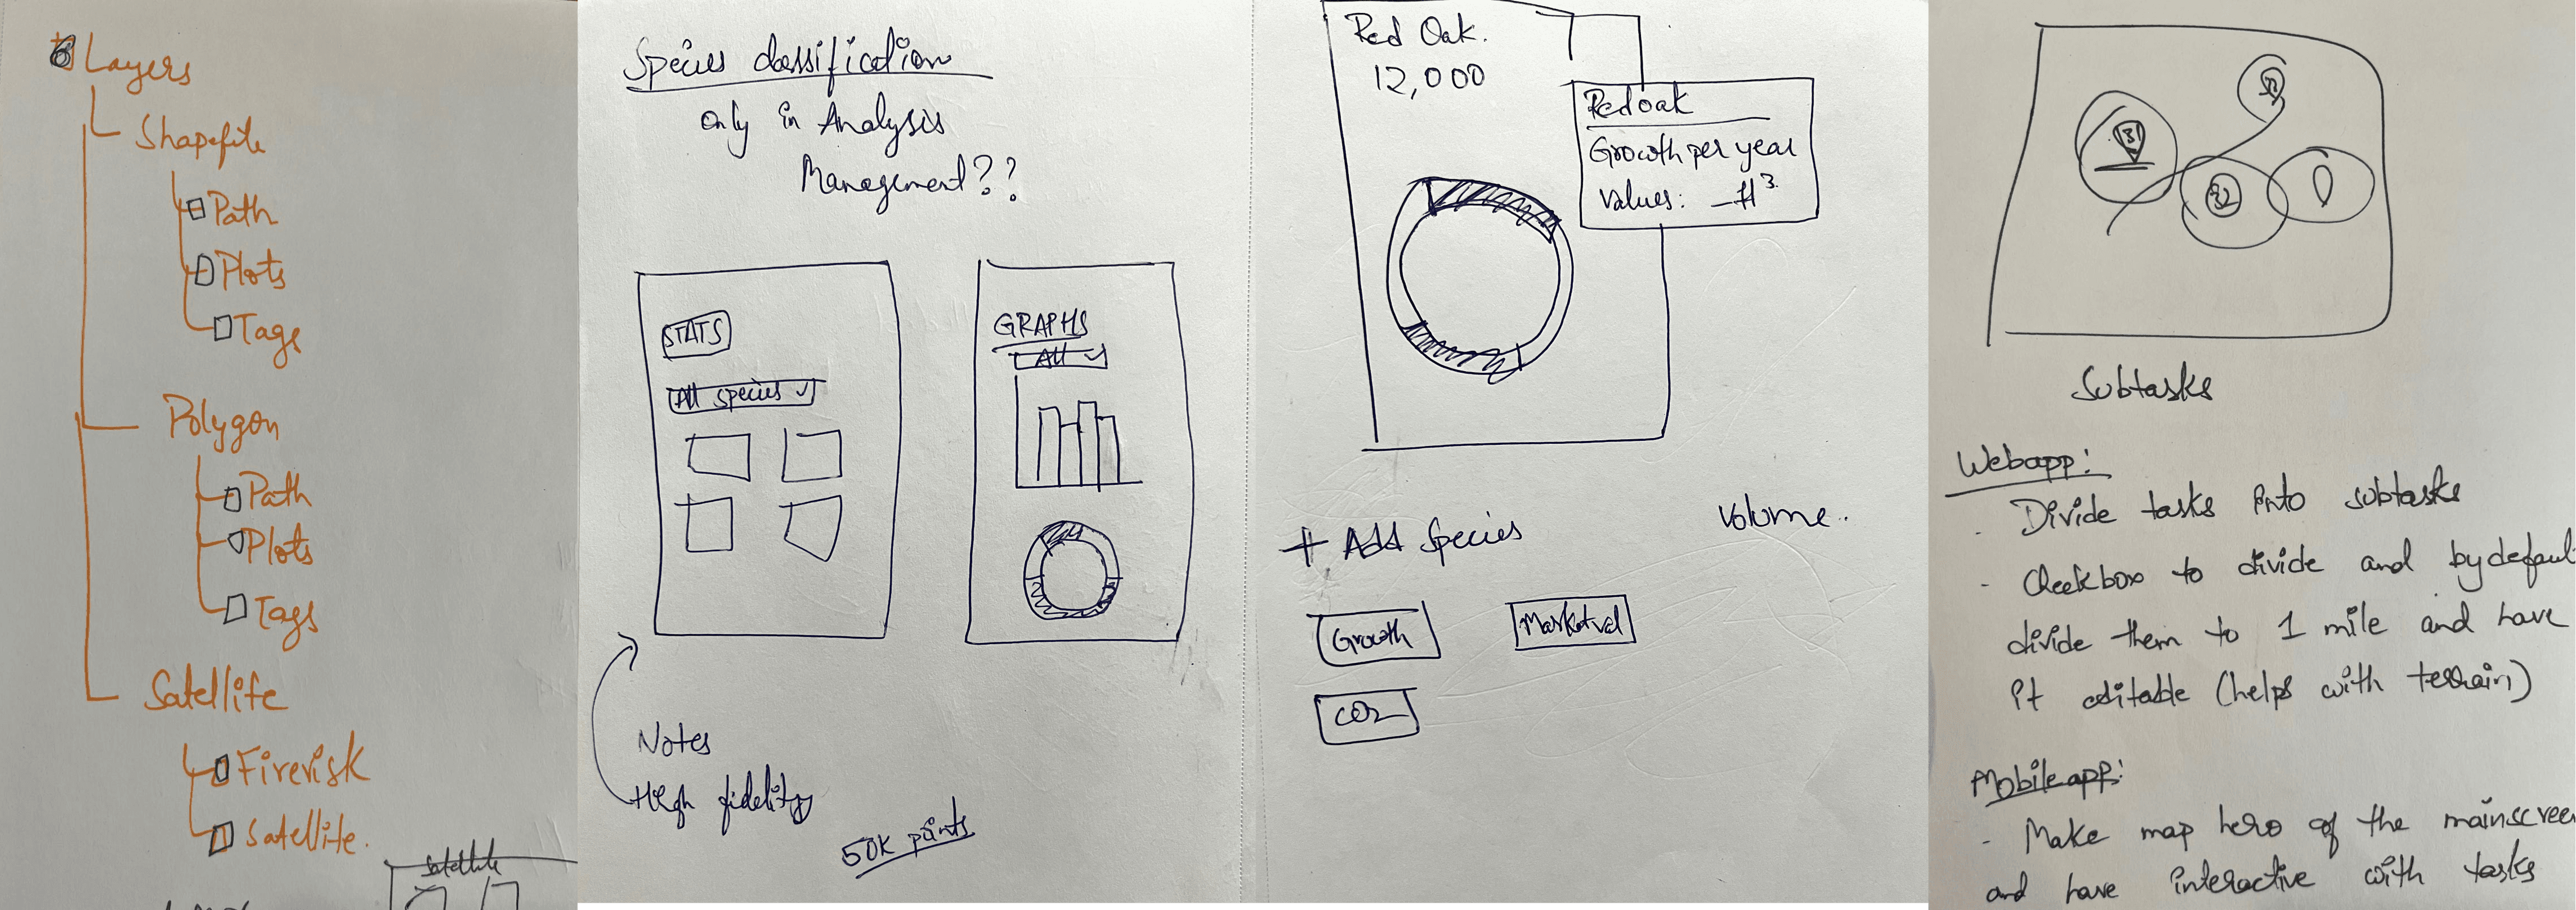
Refining different users
1. Analyze collected data: Interpret and extract insights for informed forest management.
2. Plan field data collection: Strategize logistics and organize efficient forest cruises with Gaia mobile app.
3. Plan sustainable timber Harvest: Utilize statistical insights for the long-term health and productivity of the forest.
Information Architecture
Mapping the path to customer satisfaction
Through my user interview process, we discovered the need to tailor the workflow for easier navigation through complex tree data statistics. This adjustment is essential for enhancing customer satisfaction.
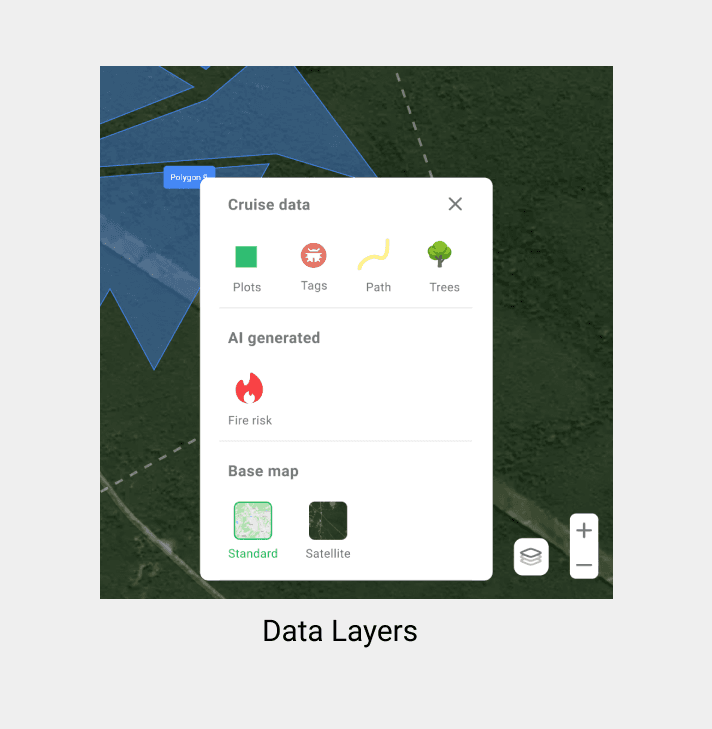
I developed forest map visualizations to provide a clearer view of the forest, particularly useful for assessing fire risks
Allow users to access polygon and plot-level data effortlessly
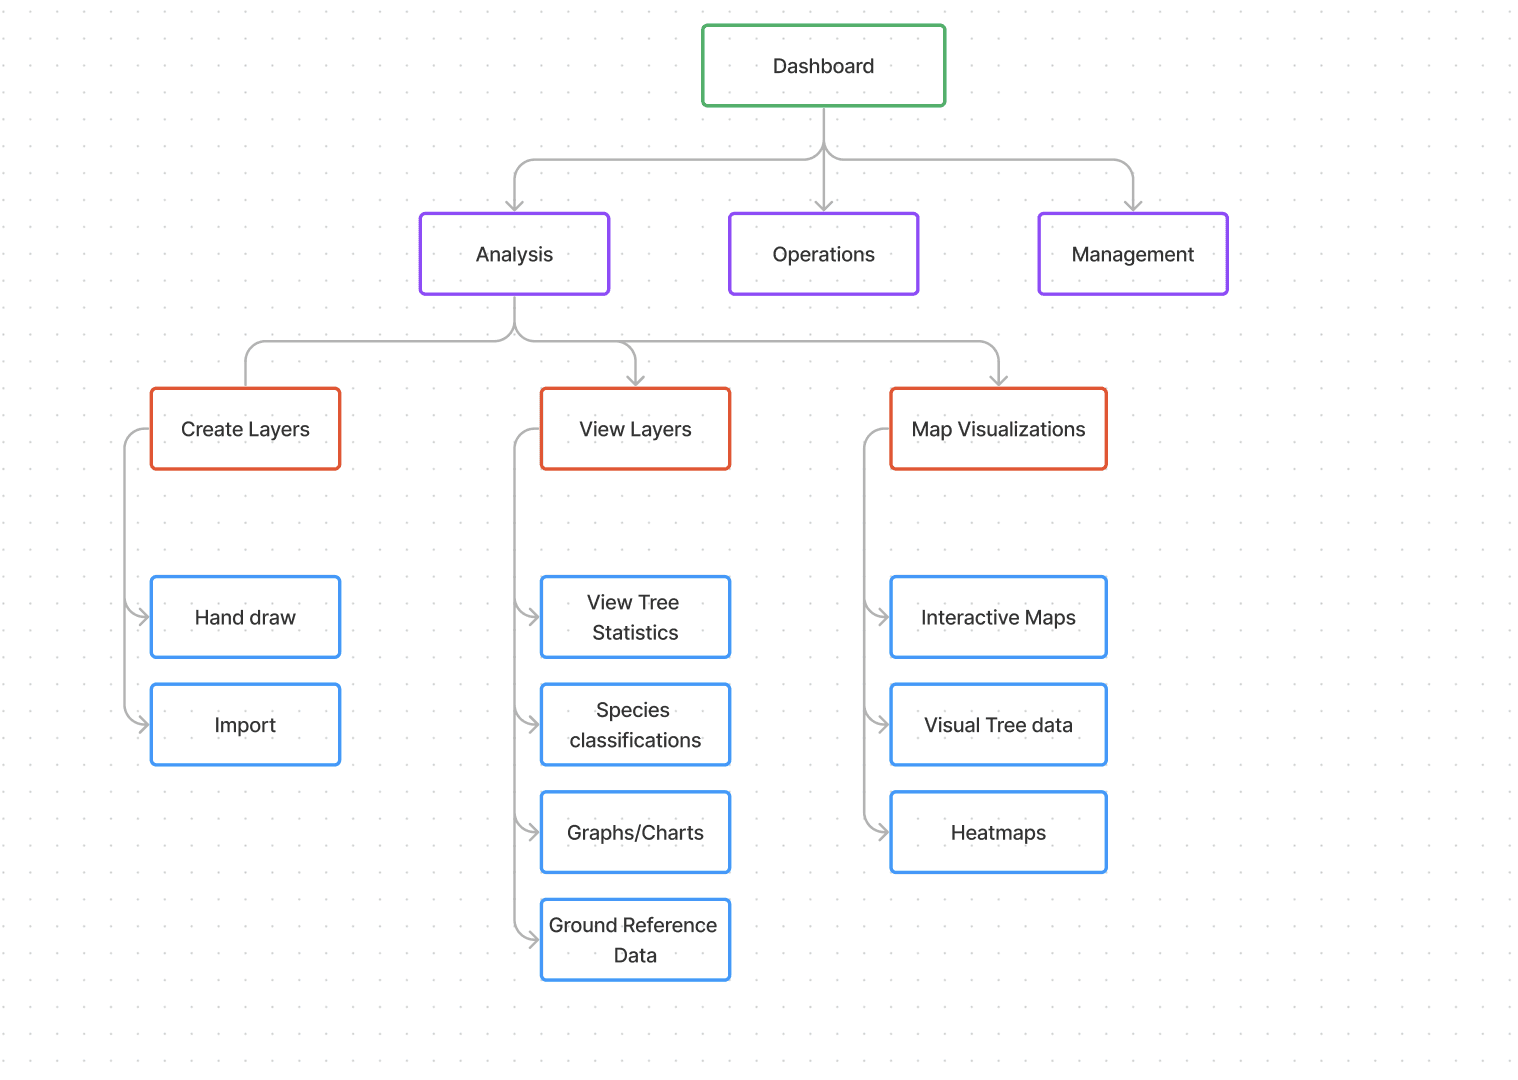
*This case study discusses Analysis mode
Low Fidelity Prototypes
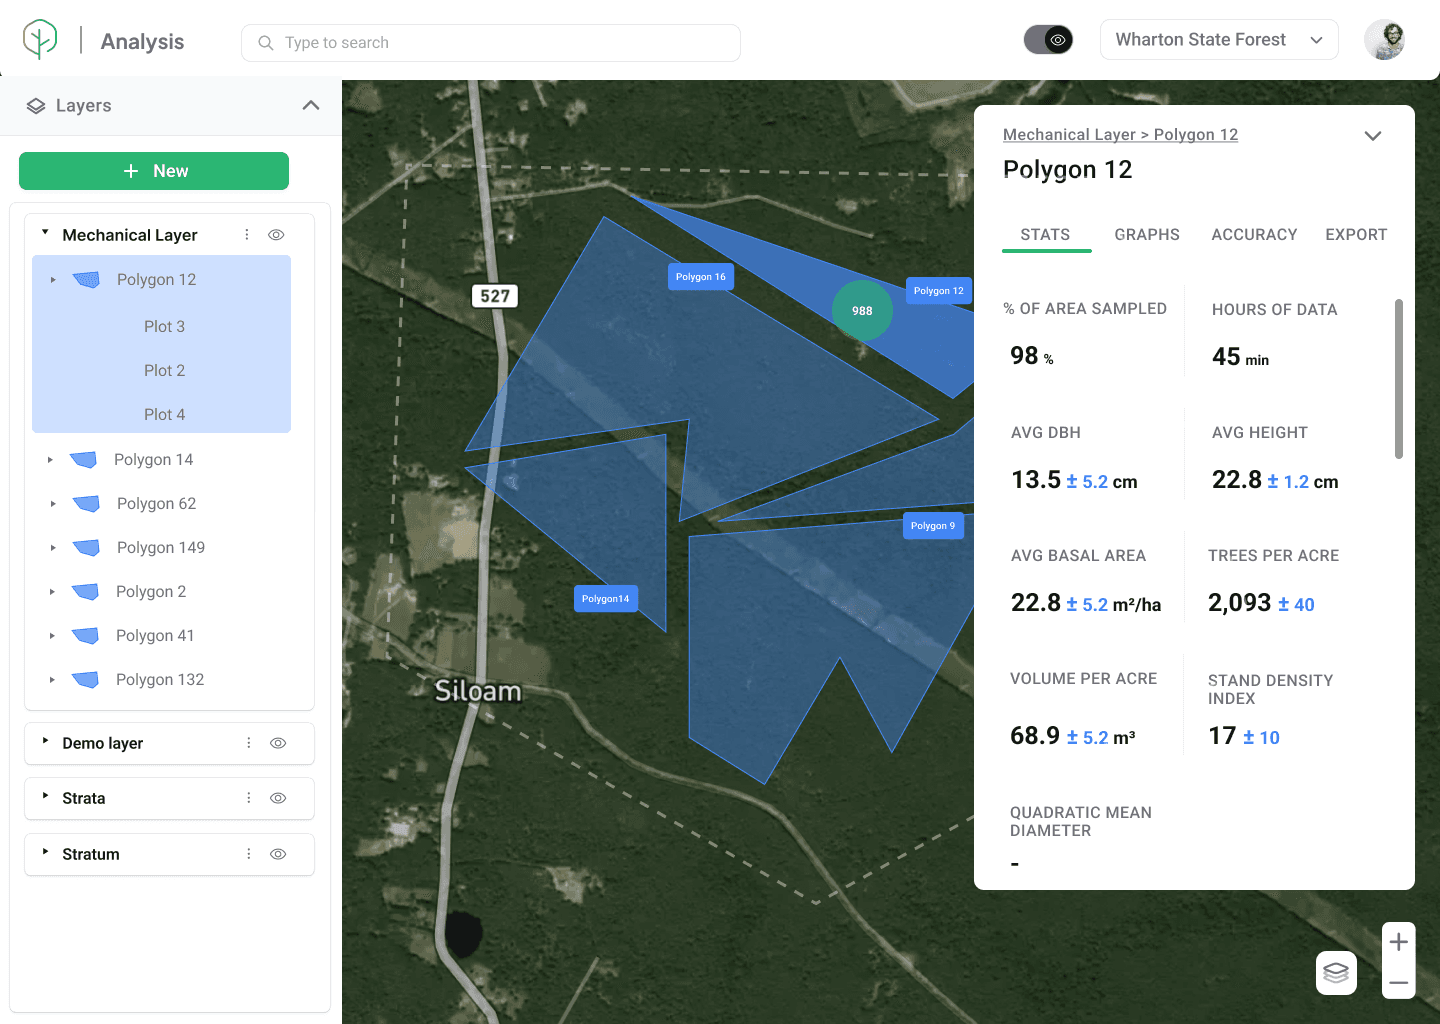
In analysis mode, my goal was to present the data collected efficiently and in a manner compliant with industry standards such as timber and forestry management services. In forestry, data is typically collected at a plot level for carbon plots and timber harvest, and these plots are combined to form polygons with visual representation on the map, which our technology can facilitate. I experimented with various layouts but found it challenging to consolidate all the data onto a single screen.
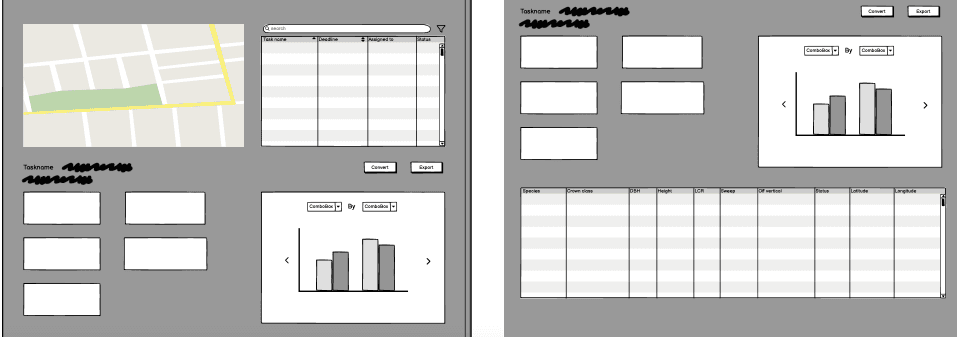
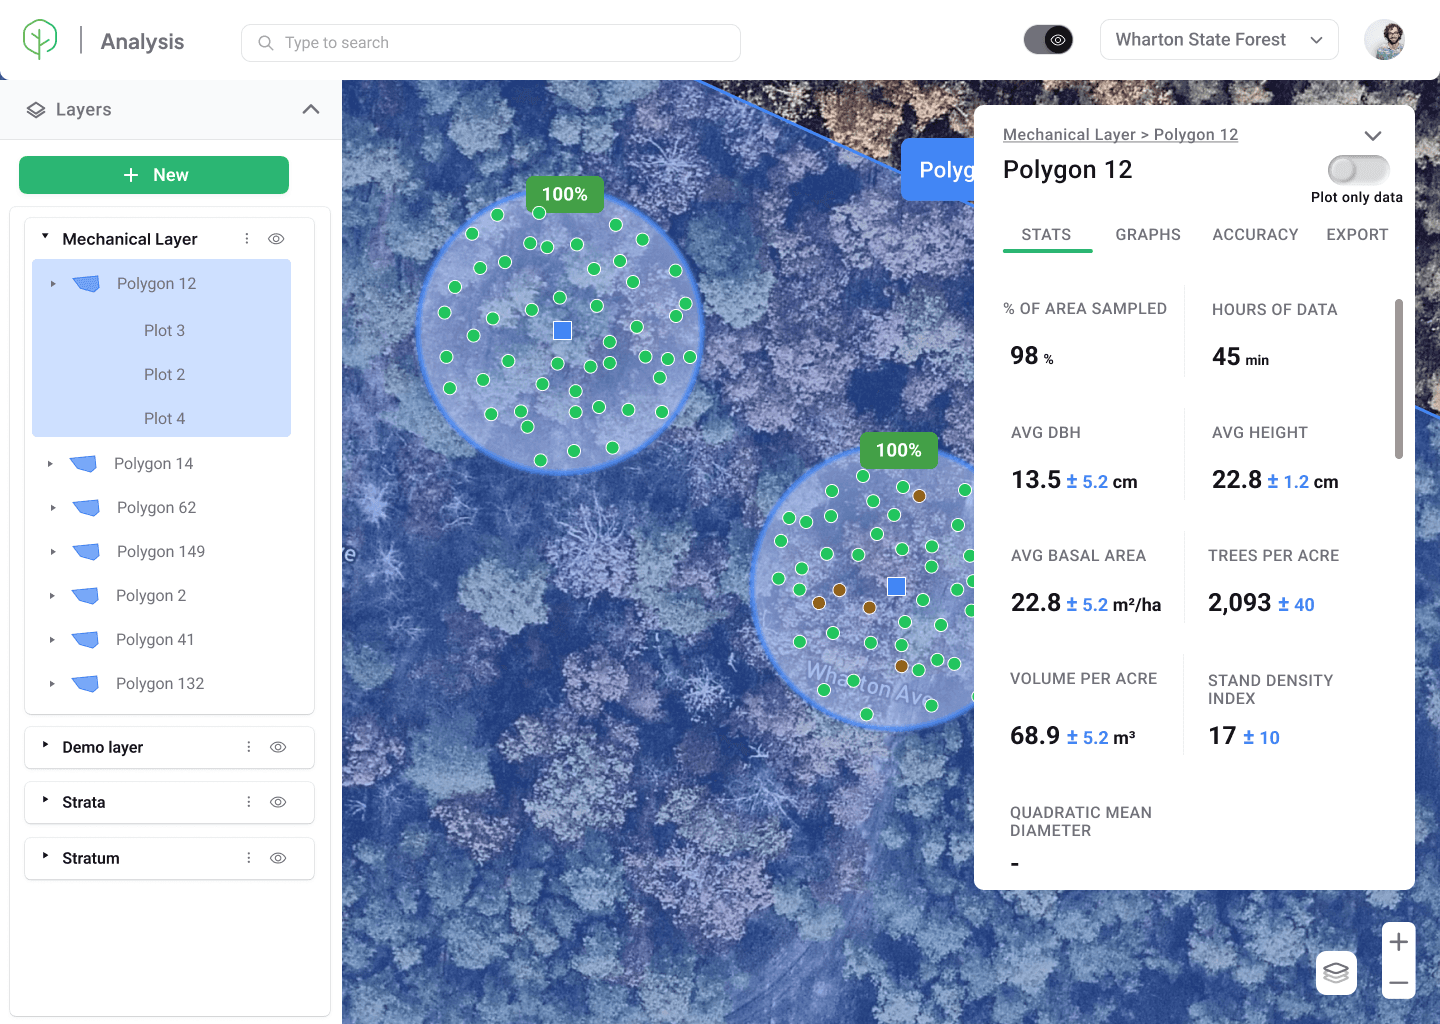
After multiple iterations, I opted to prioritize the map as the centerpiece of the platform, with location selection on the left and corresponding results displayed on the right.
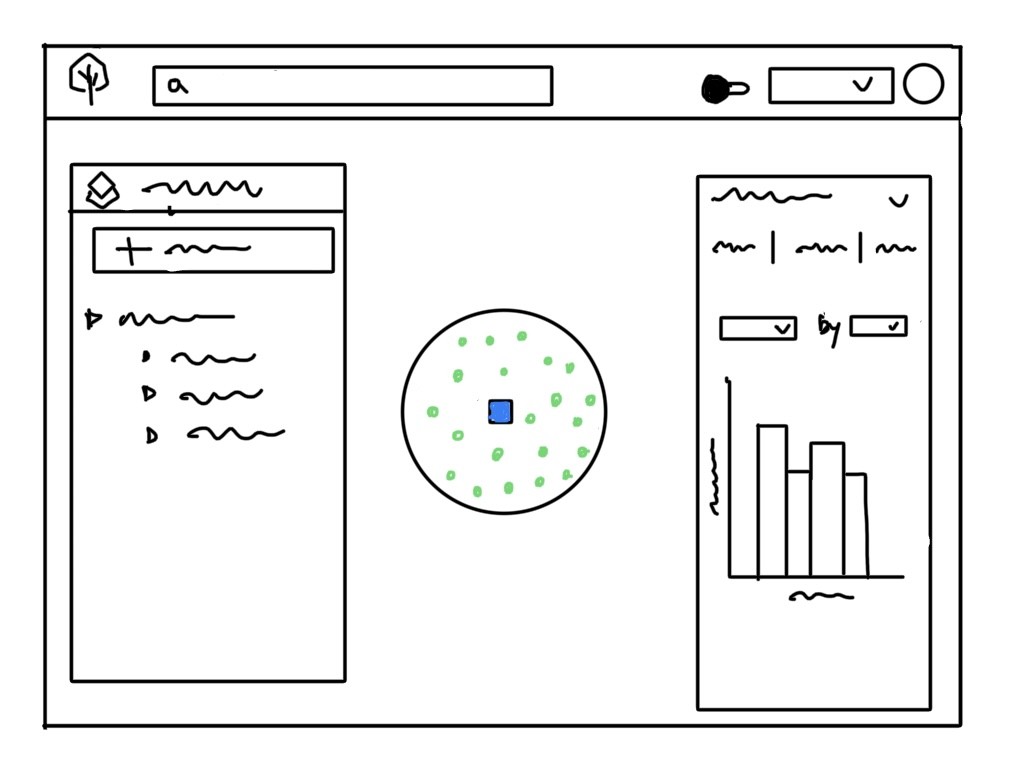
High Fidelity Designs
After several conversations, ideation and efforts I finally landed up on organizing the information in the visually representative forest with tree stats and metrics for better visualizing forest data

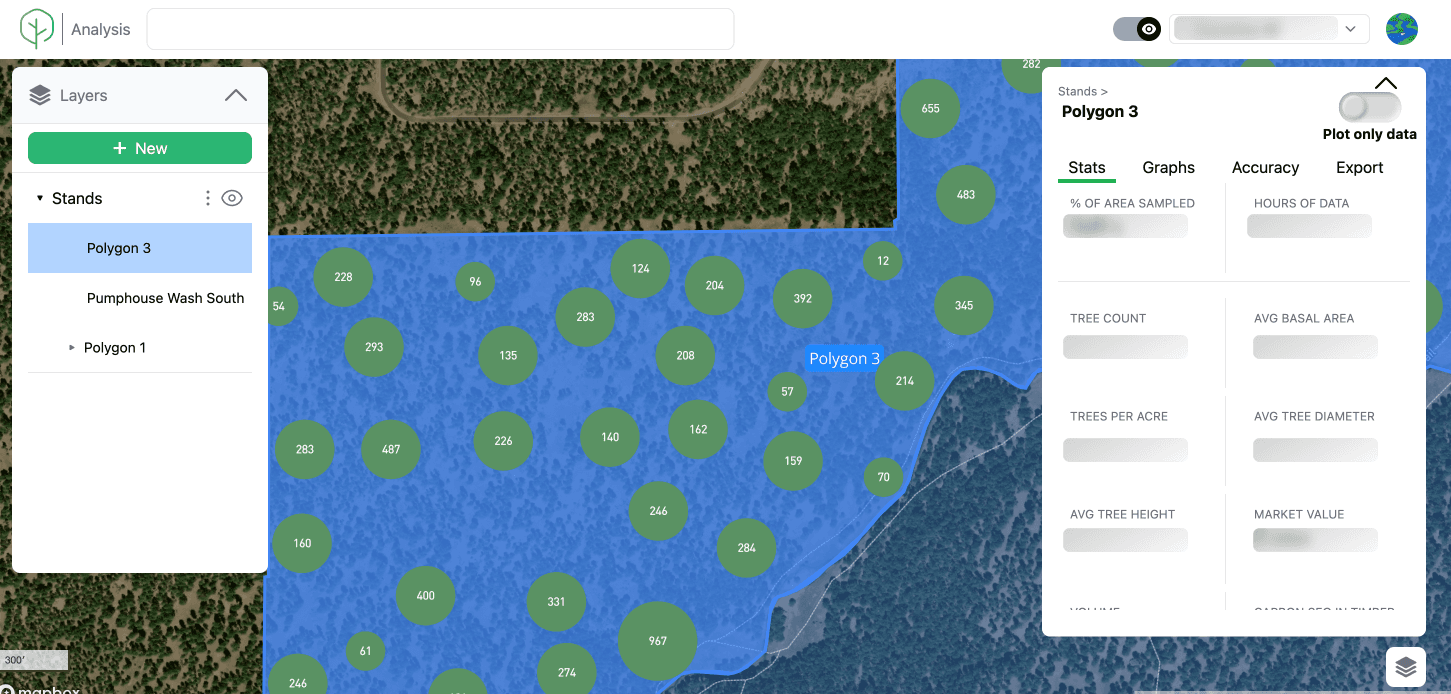
Attaching some real time data

Next steps
I'm currently in the process of iterating this, integrate new feature requests and introducing a new mode to manage and harvest forests
