Enhancing Operational Efficiency at Gaia
An internal dashboard to track the statuses of its diverse departments
Background
Gaia, a dynamic startup specializing in satellite imagery, robotics, computer vision, hardware, and platform technologies, has experienced rapid growth in recent years. As the company expands its operations and takes on increasingly complex projects, it faces numerous challenges typical of fast-moving startups.
Challenges
Lack of Coordination: With diverse people managing different aspects of the company, coordination is challenging, leading to inefficiencies and duplicated efforts.
Delayed Decision-Making: Critical decisions are frequently delayed due to the lack of real-time insights into project statuses, resource allocation, and bottlenecks.
Performance Monitoring: Gaia's absence of a robust performance monitoring system hinders its ability to identify areas for improvement and innovation.
Lack of Accountability: Without transparent tracking mechanisms, accountability becomes elusive, leading to a lack of ownership and commitment among team members.
Solution
Recognizing the need to address these challenges, we decided to develop an internal dashboard to track the statuses of all departments. The dashboard will provide real-time insights into project progress, data collection and performance metrics, enabling to make informed decisions and streamline operations.
Process
In approaching the design process for our internal dashboard, I recognized the unique nature of our project, where inputs and requirements were solely derived from our team members, making it highly customized to our organization's needs. Given this context, I opted to utilize the double diamond technique, a method known for its focus on divergent and convergent thinking, to efficiently navigate our design process within the tight timeframe of two weeks.
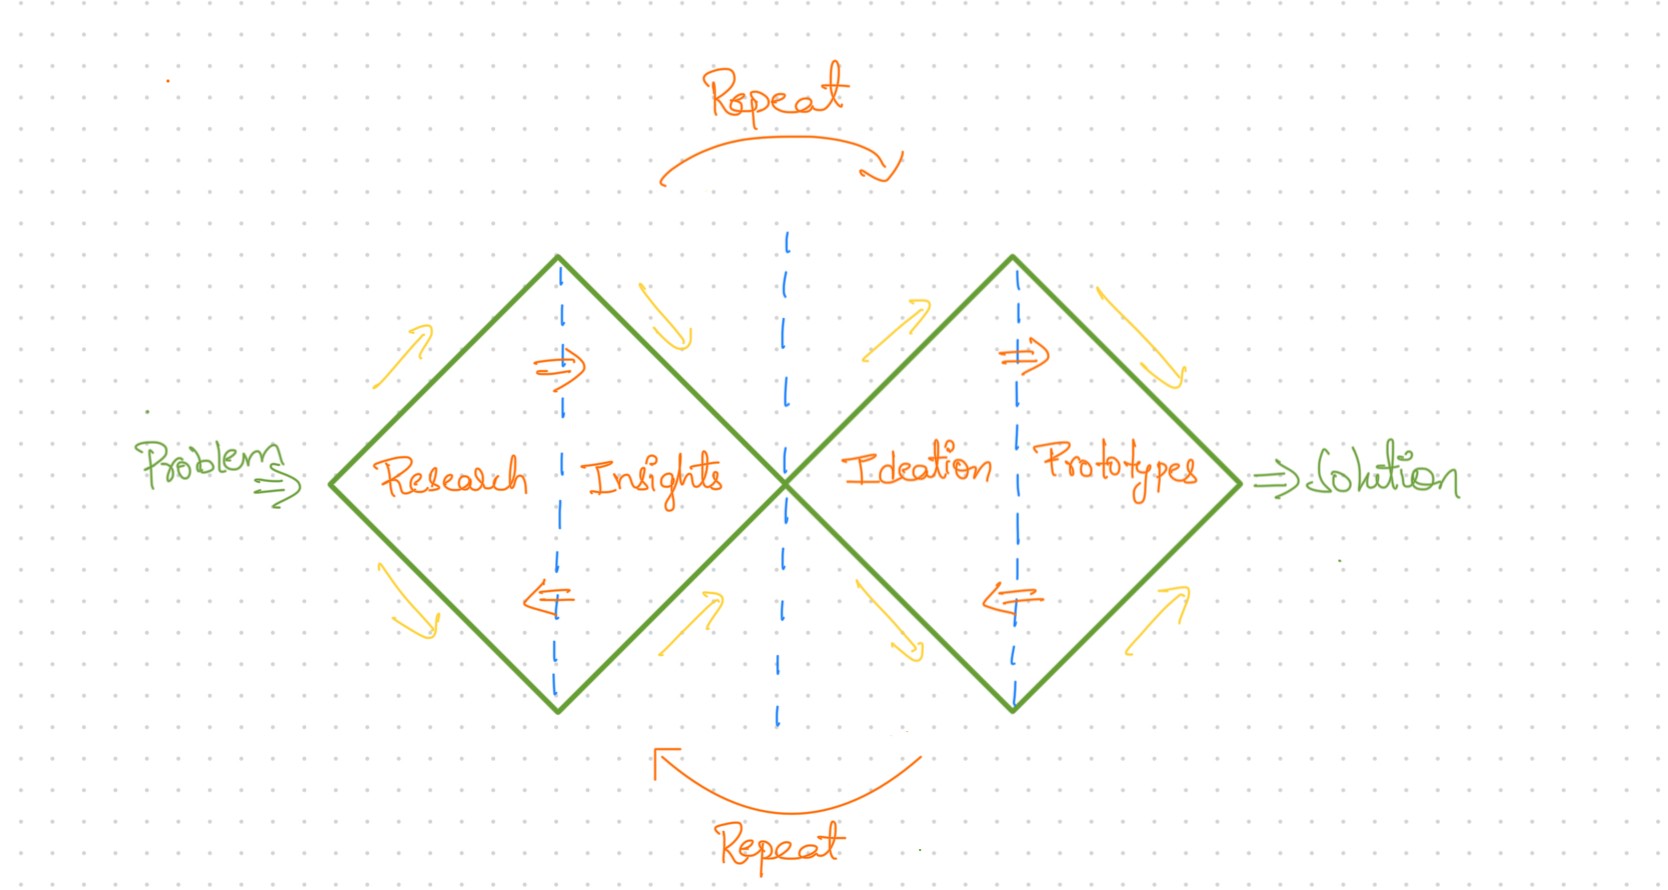
To kickstart the process, I engaged in discussions with my co-workers, who are the end users of the internal dashboard. considering its primary use within our organization. As each of us is involved in different departments of product development, it was crucial to thoroughly understand their unique workflows and identify the specific metrics essential for tracking progress effectively. Through individual conversations and collaborative sessions, I gained valuable insights into their needs and requirements, ensuring that the dashboard would be tailored to support their tasks and contribute overall product development efforts.

After gathering insights from the team, I structured the internal dashboard by breaking down information into key categories for each department. I then created a visual prototype to outline the layout and components of the dashboard, ensuring it would effectively serve users' needs and facilitate informed decision-making
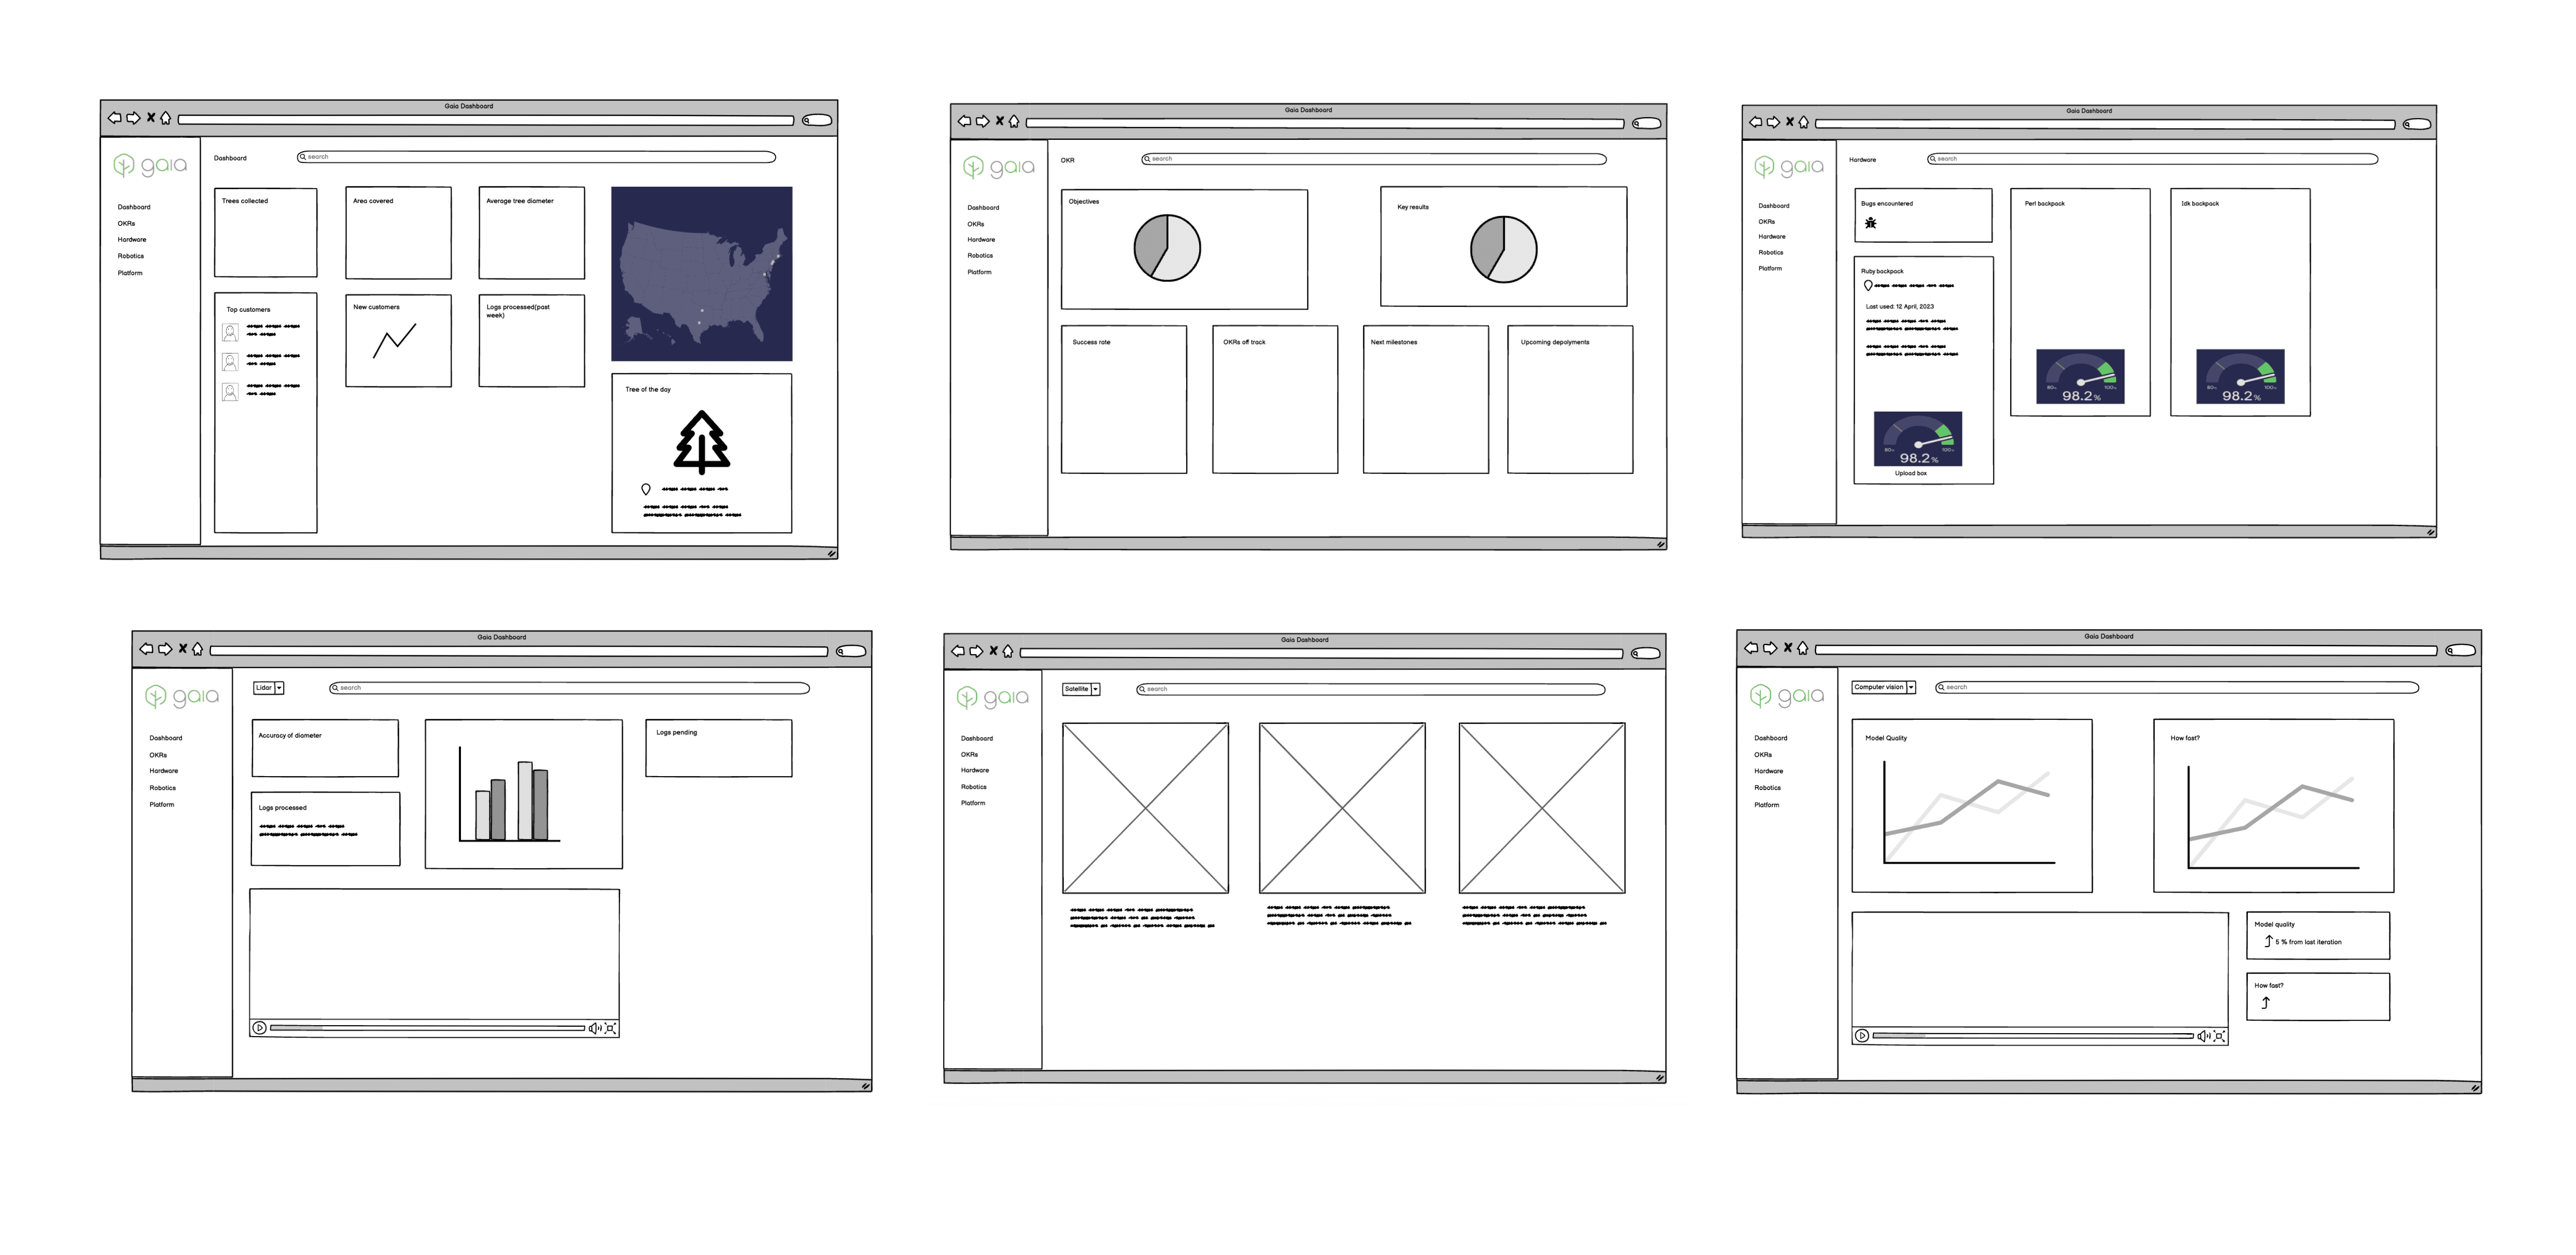
Based on the requirements gathered from co-workers/target users, I created few wireframes to visualize the initial layout and functionality of the internal dashboard. These wireframes served as a preliminary draft for review and feedback. Following the initial review, I further refined the designs into high-fidelity prototypes, incorporating detailed visuals, interactive elements.
High Fidelity Designs
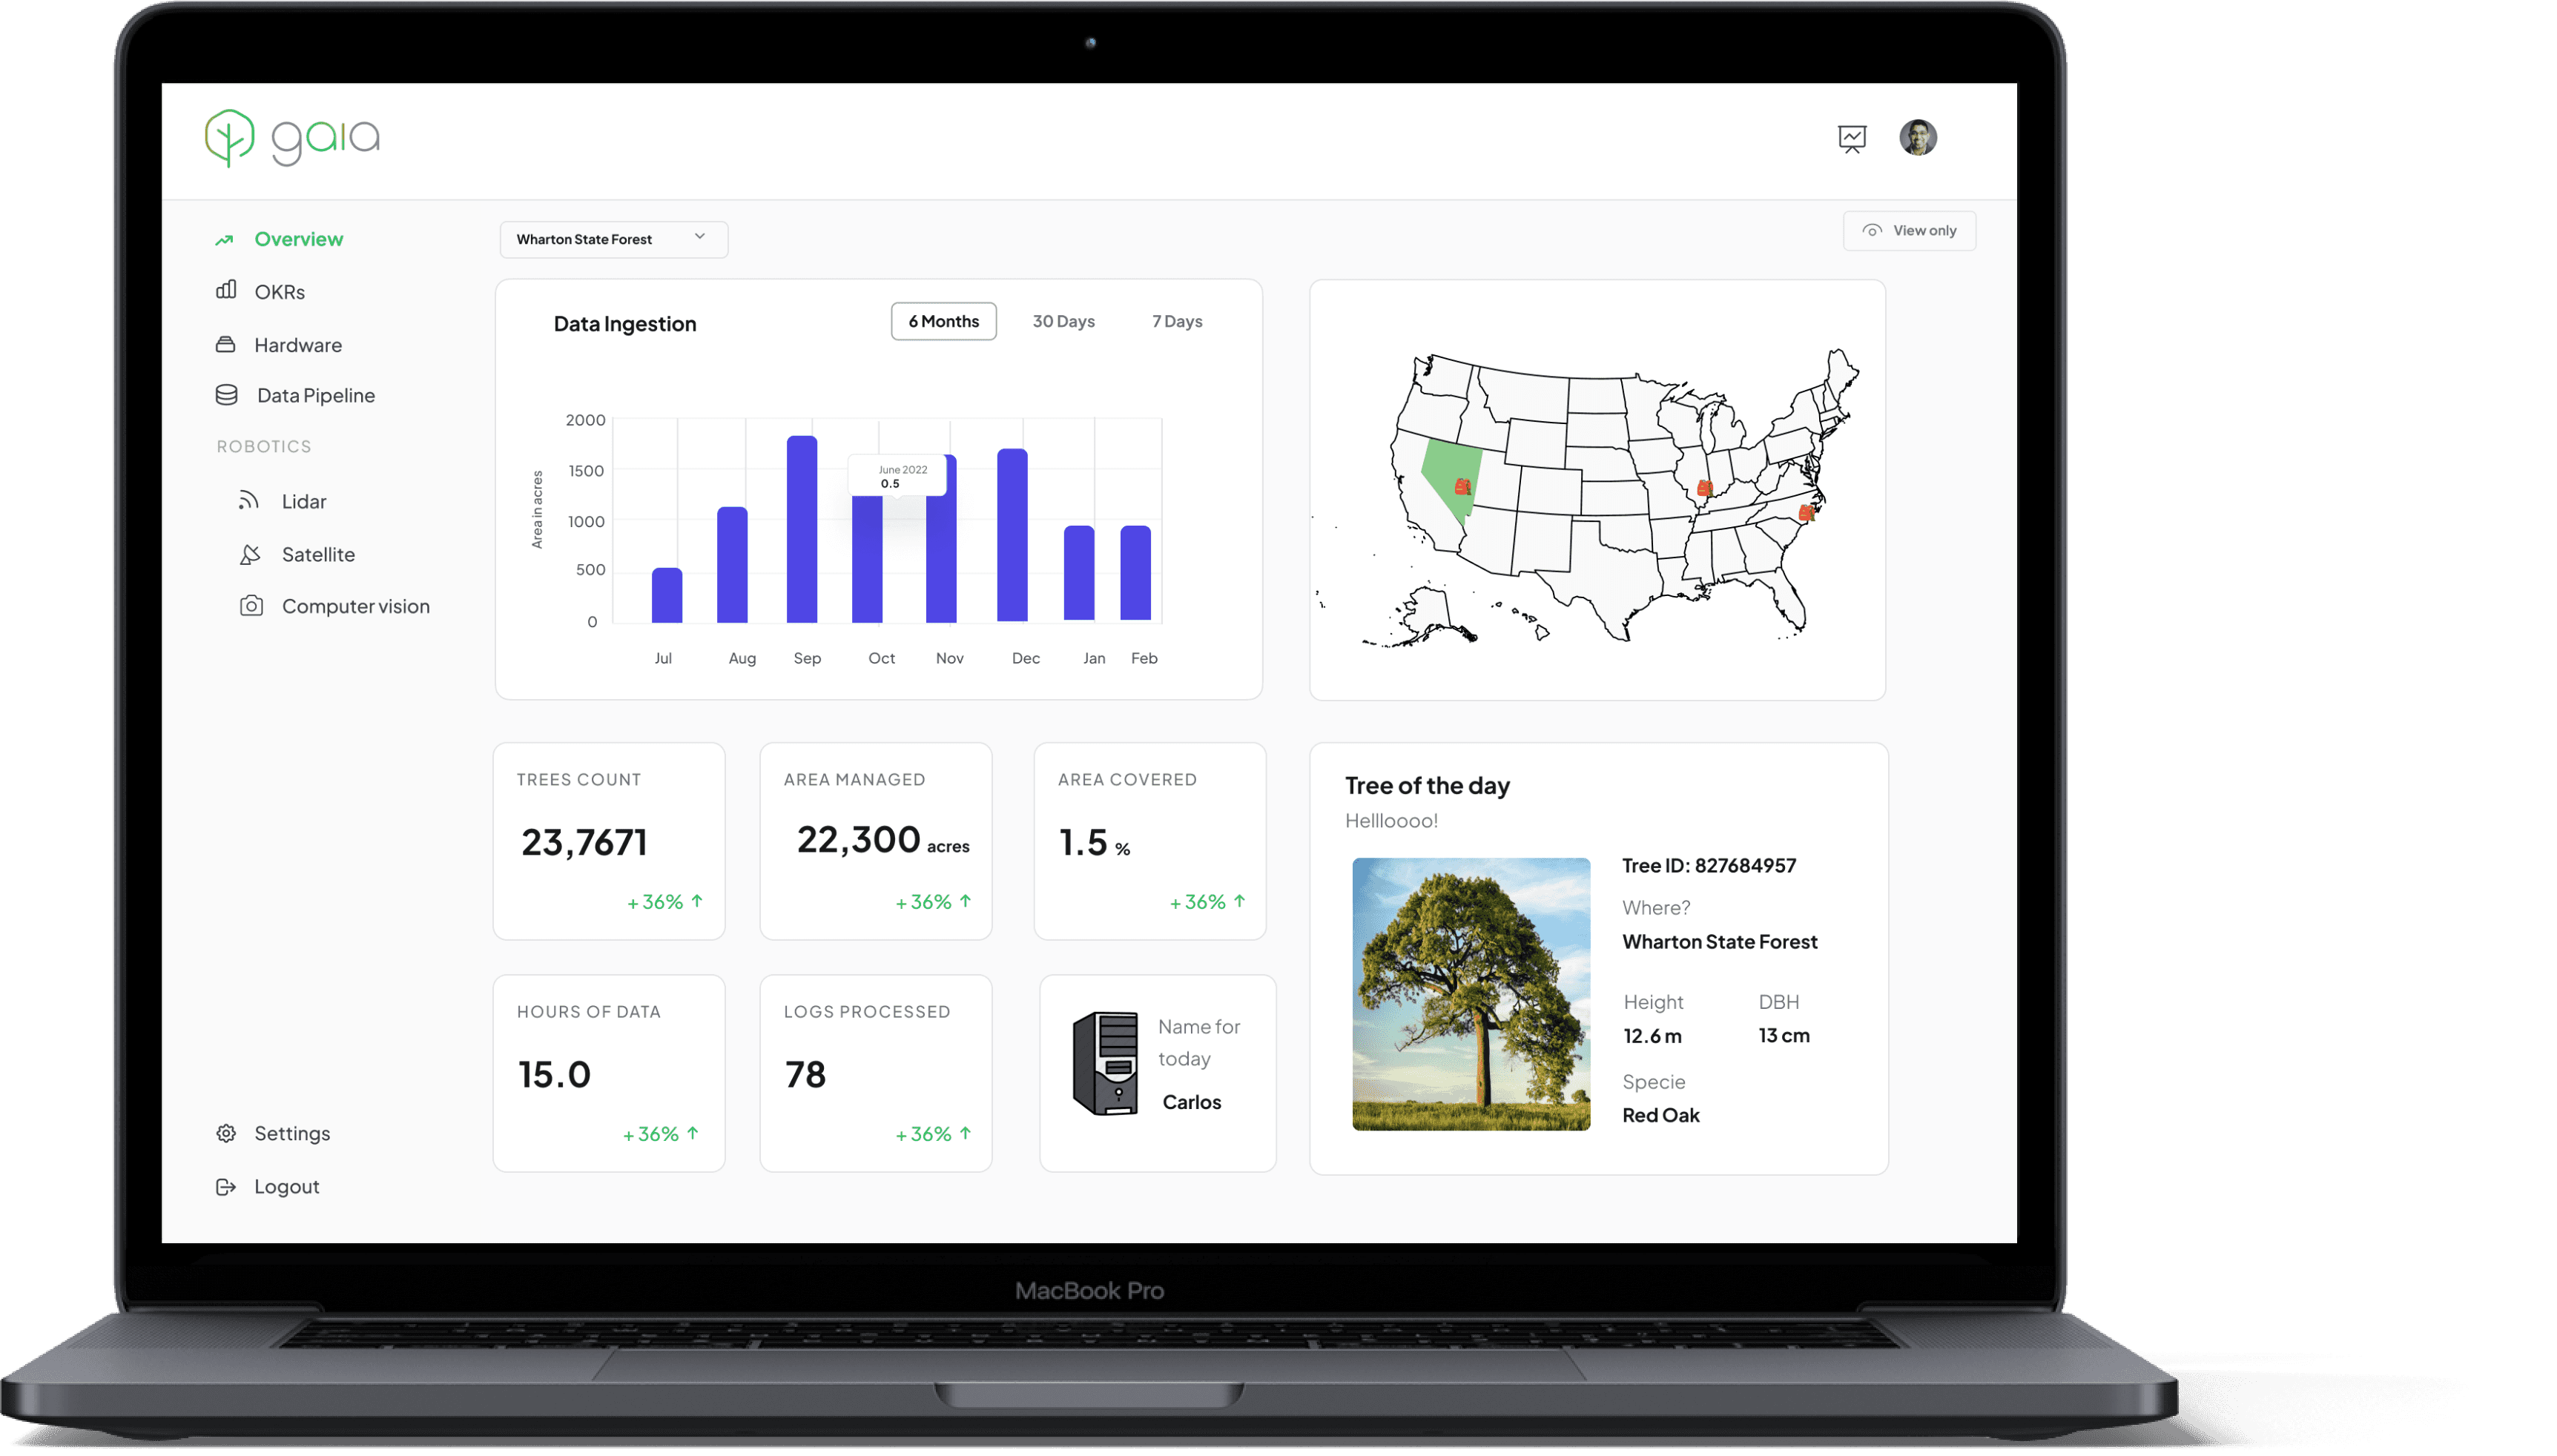
Overview: The overview page features details of the selected region, including data ingestion graphs and maps displaying current backpack locations. Additionally, it incorporates a fun cultural element such as the "Tree of the day".
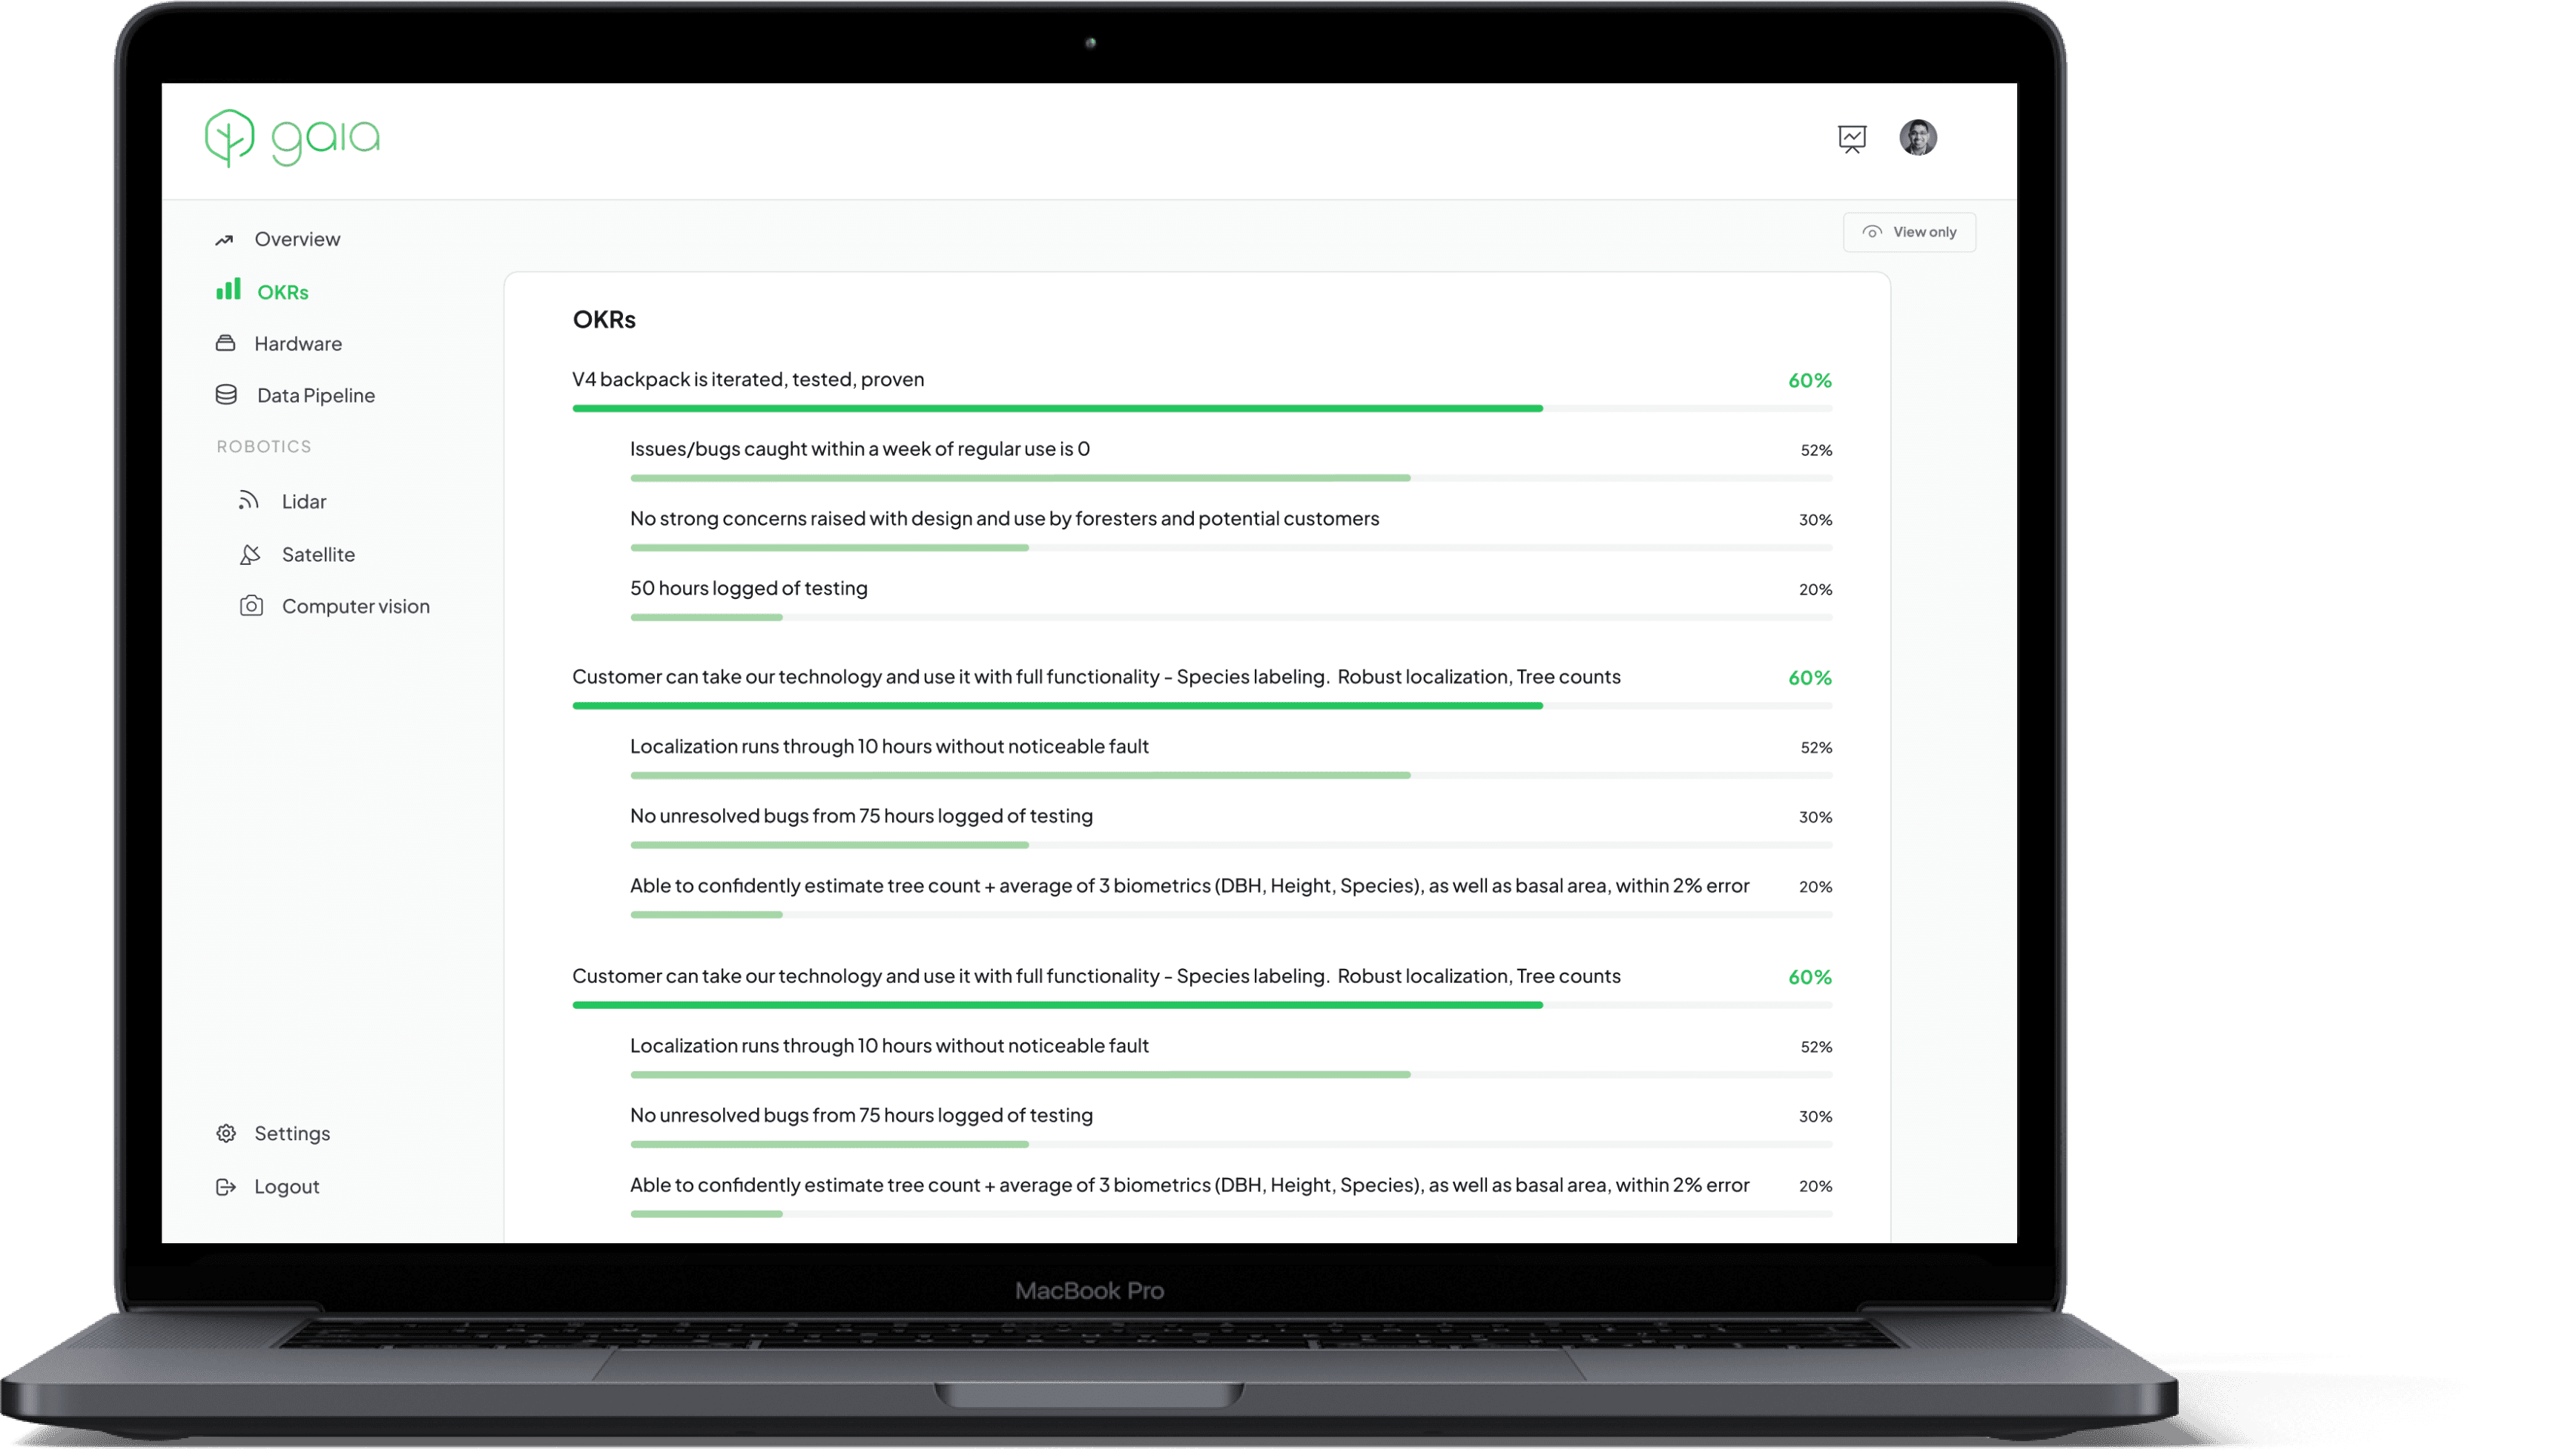
OKRs: Keeping track of OKRs (Objectives and Key Results) was crucial, ensuring everyone remained aware of their objectives and progress, all easily monitored through the dashboard
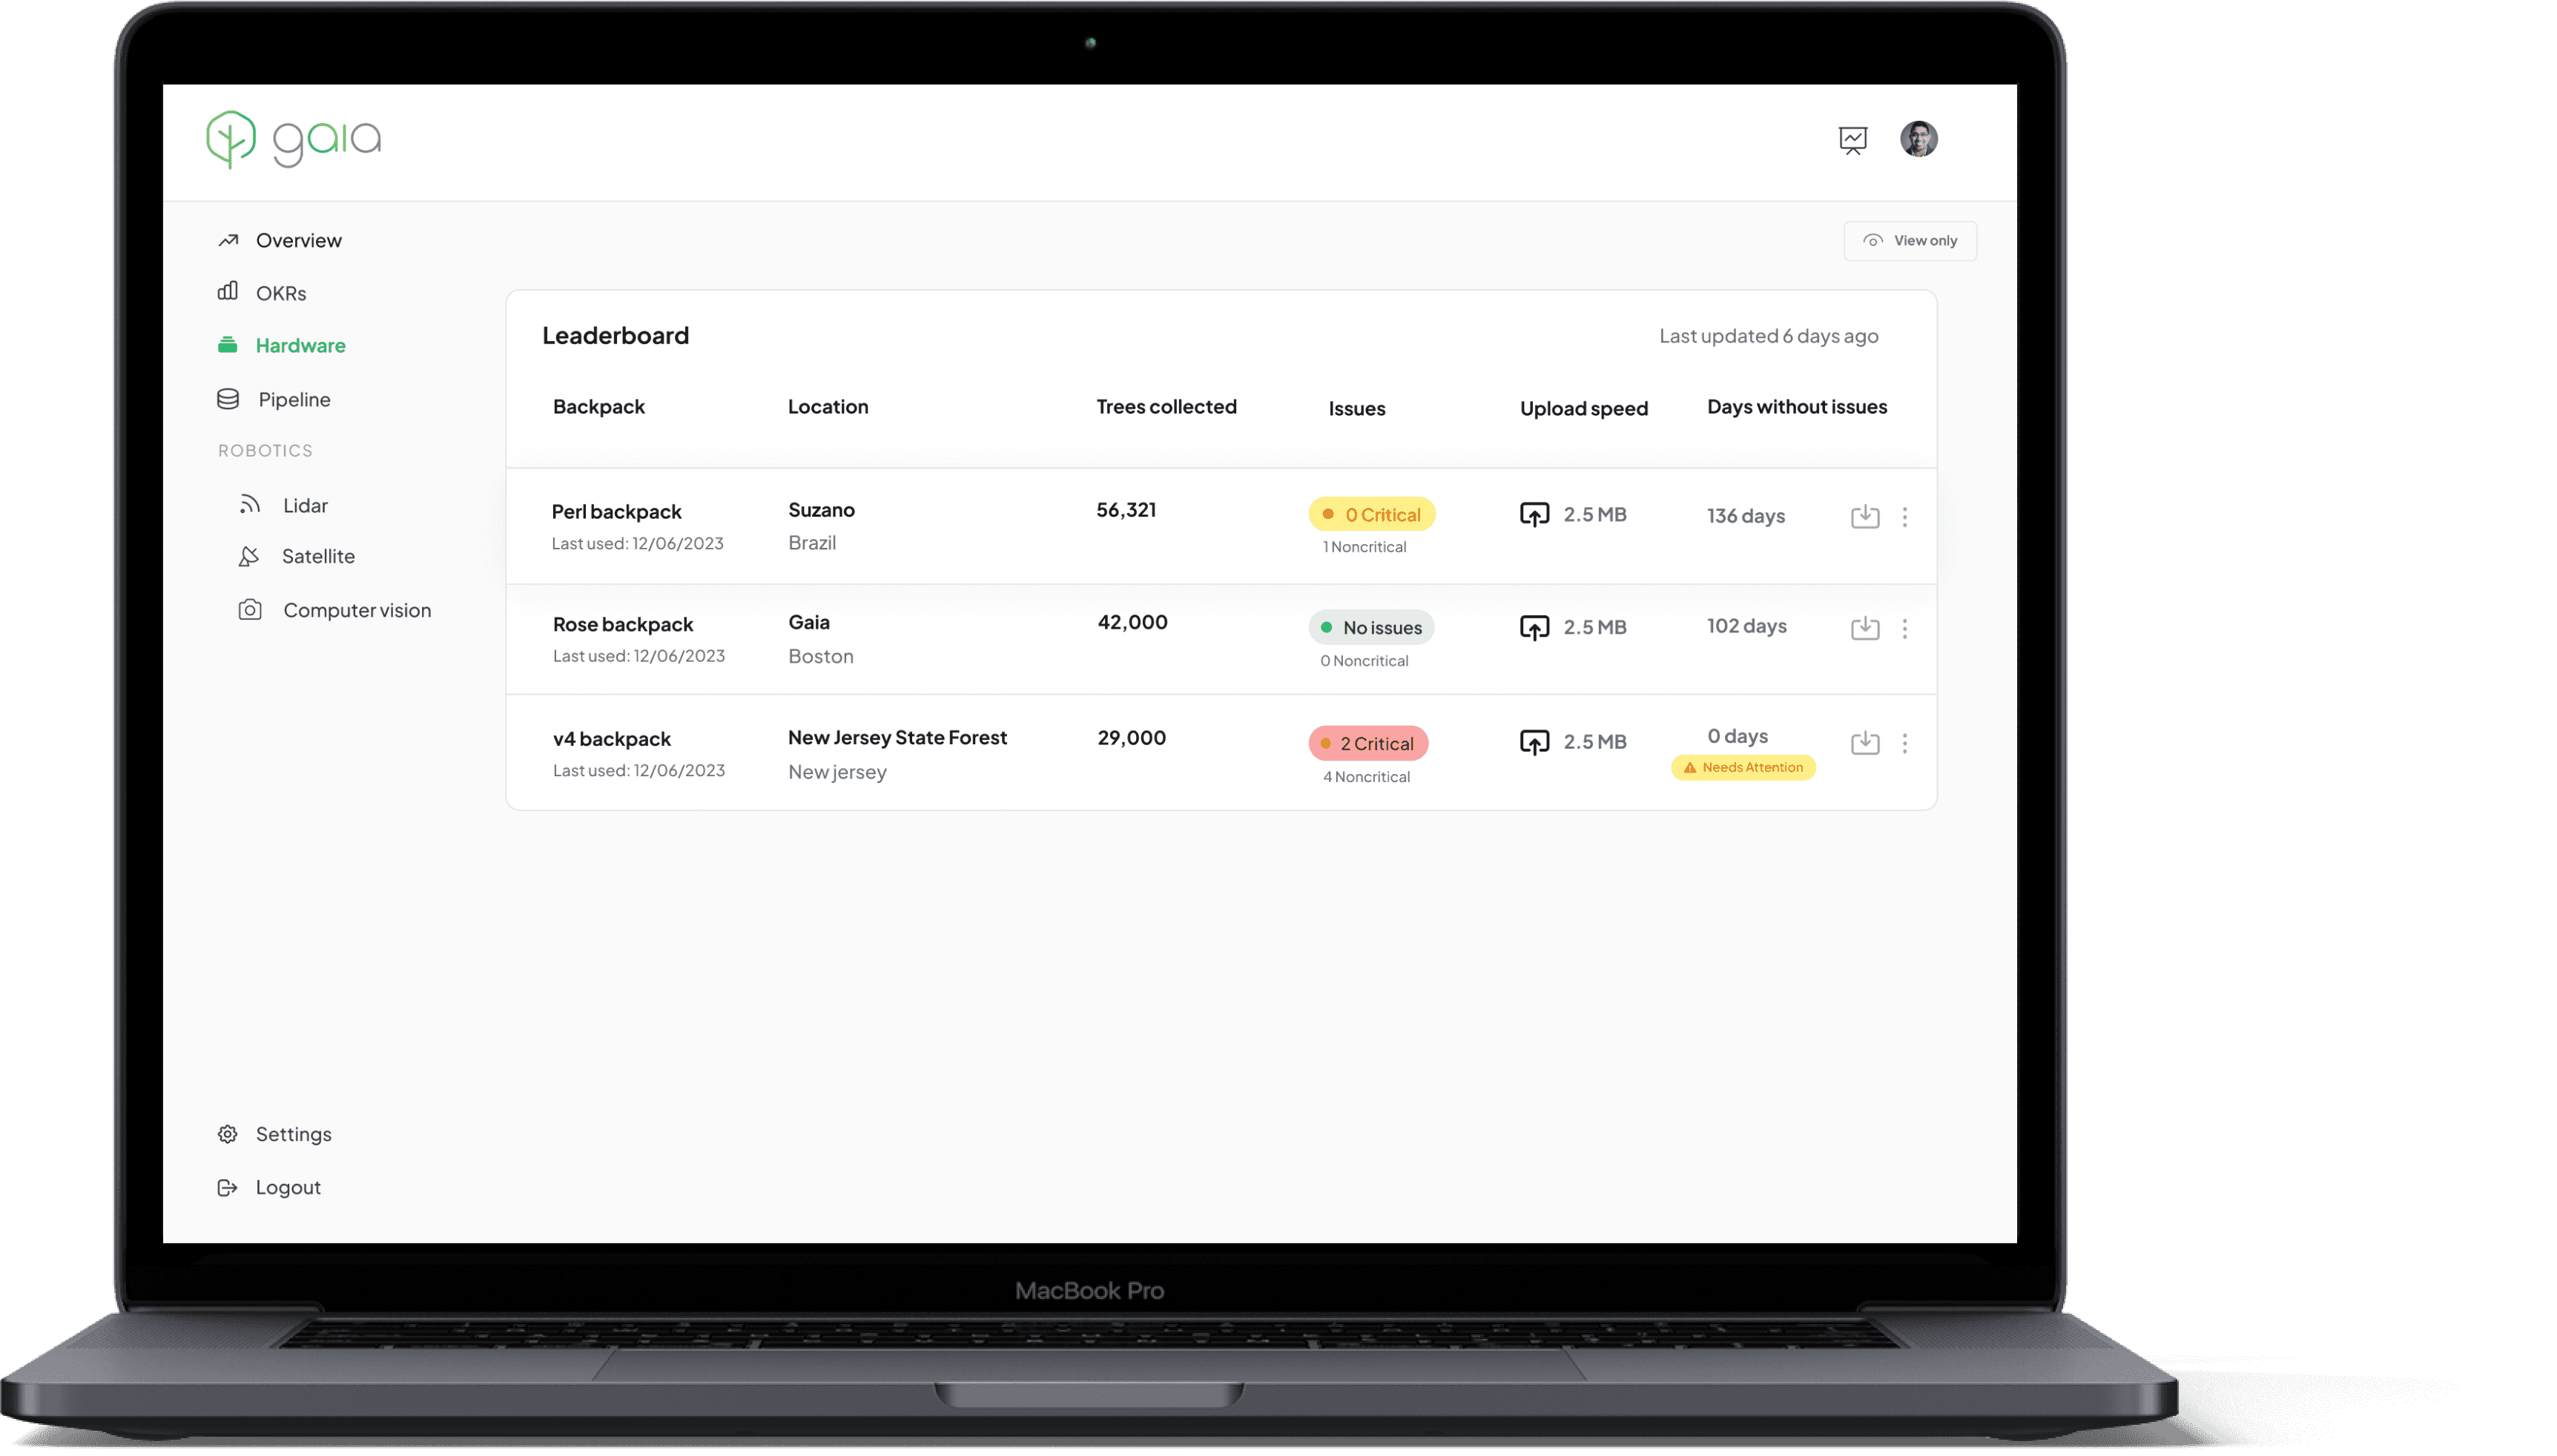
Hardware: The hardware team plays a crucial role in successful data collection and the company's growth. Specifically, their task is to build and continuously monitor the status of the backpacks/hardware, which are assigned to customers. Given the high value of these items, continuous monitoring is essential for the company's operations
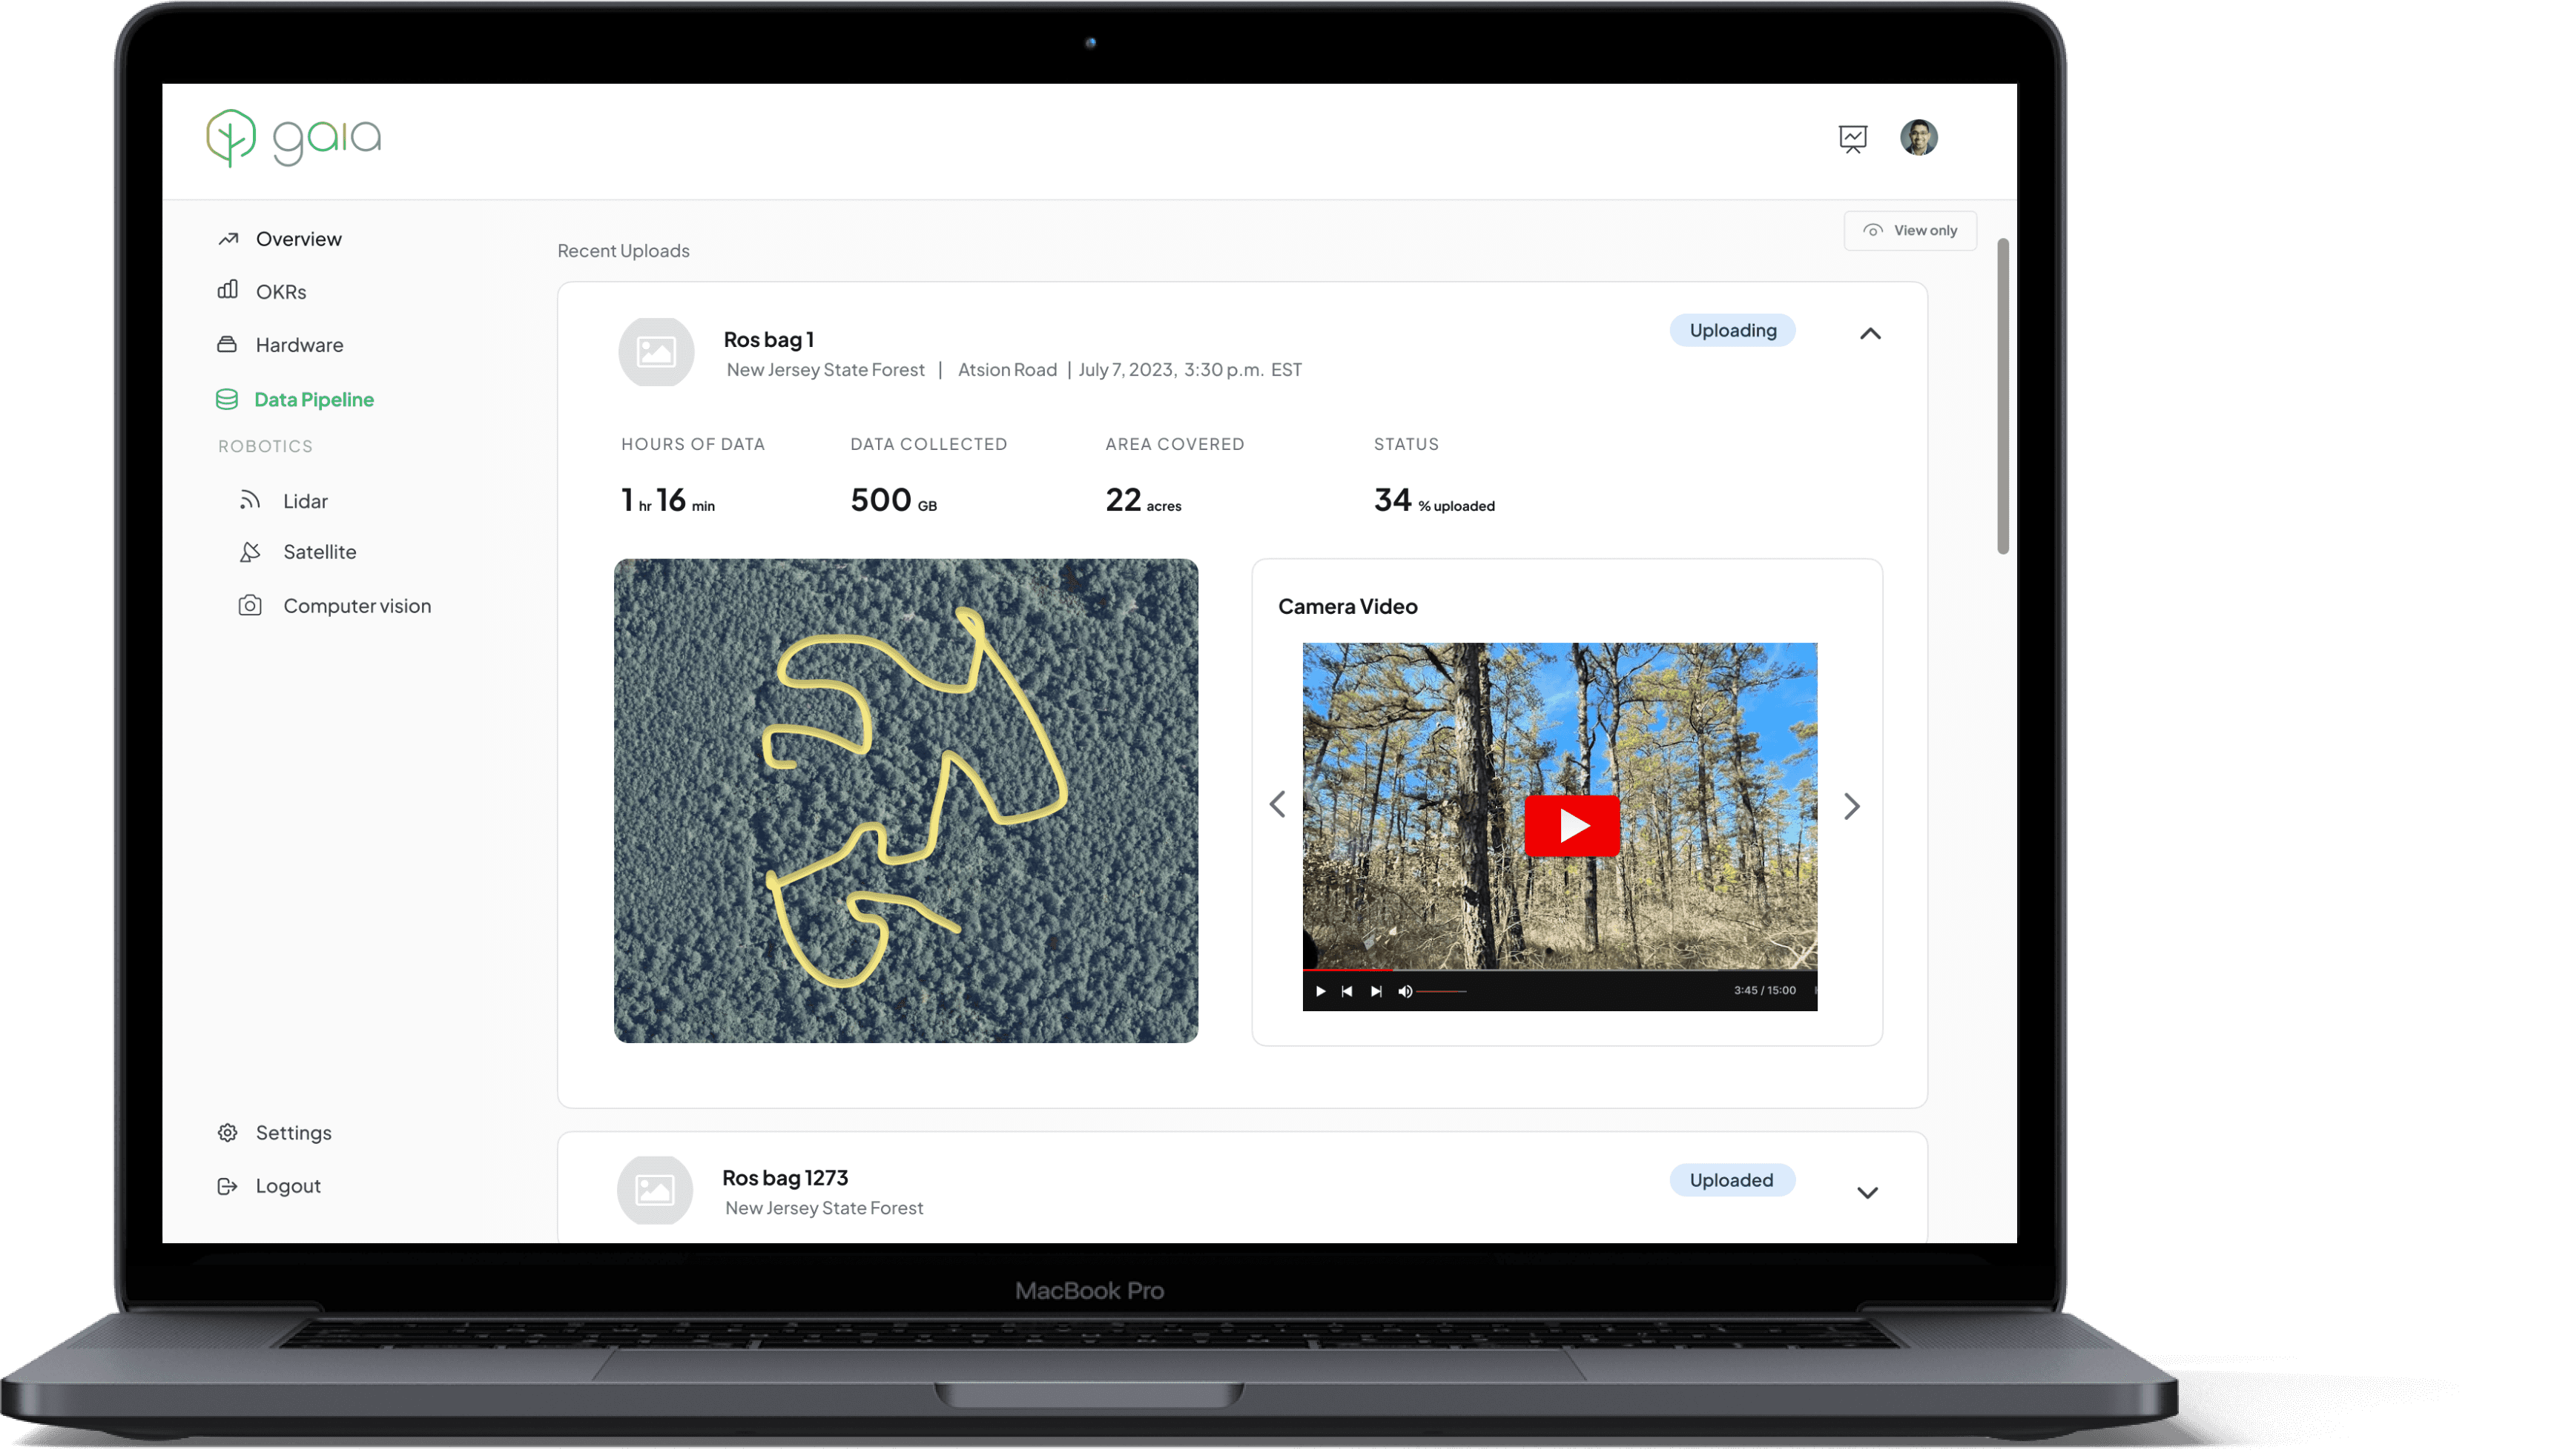
Data Pipeline: Data pipeline page encompasses ROS bags of individual data collections, providing specifics such as location, time, duration of backpack operation, data volume collected, and the covered area
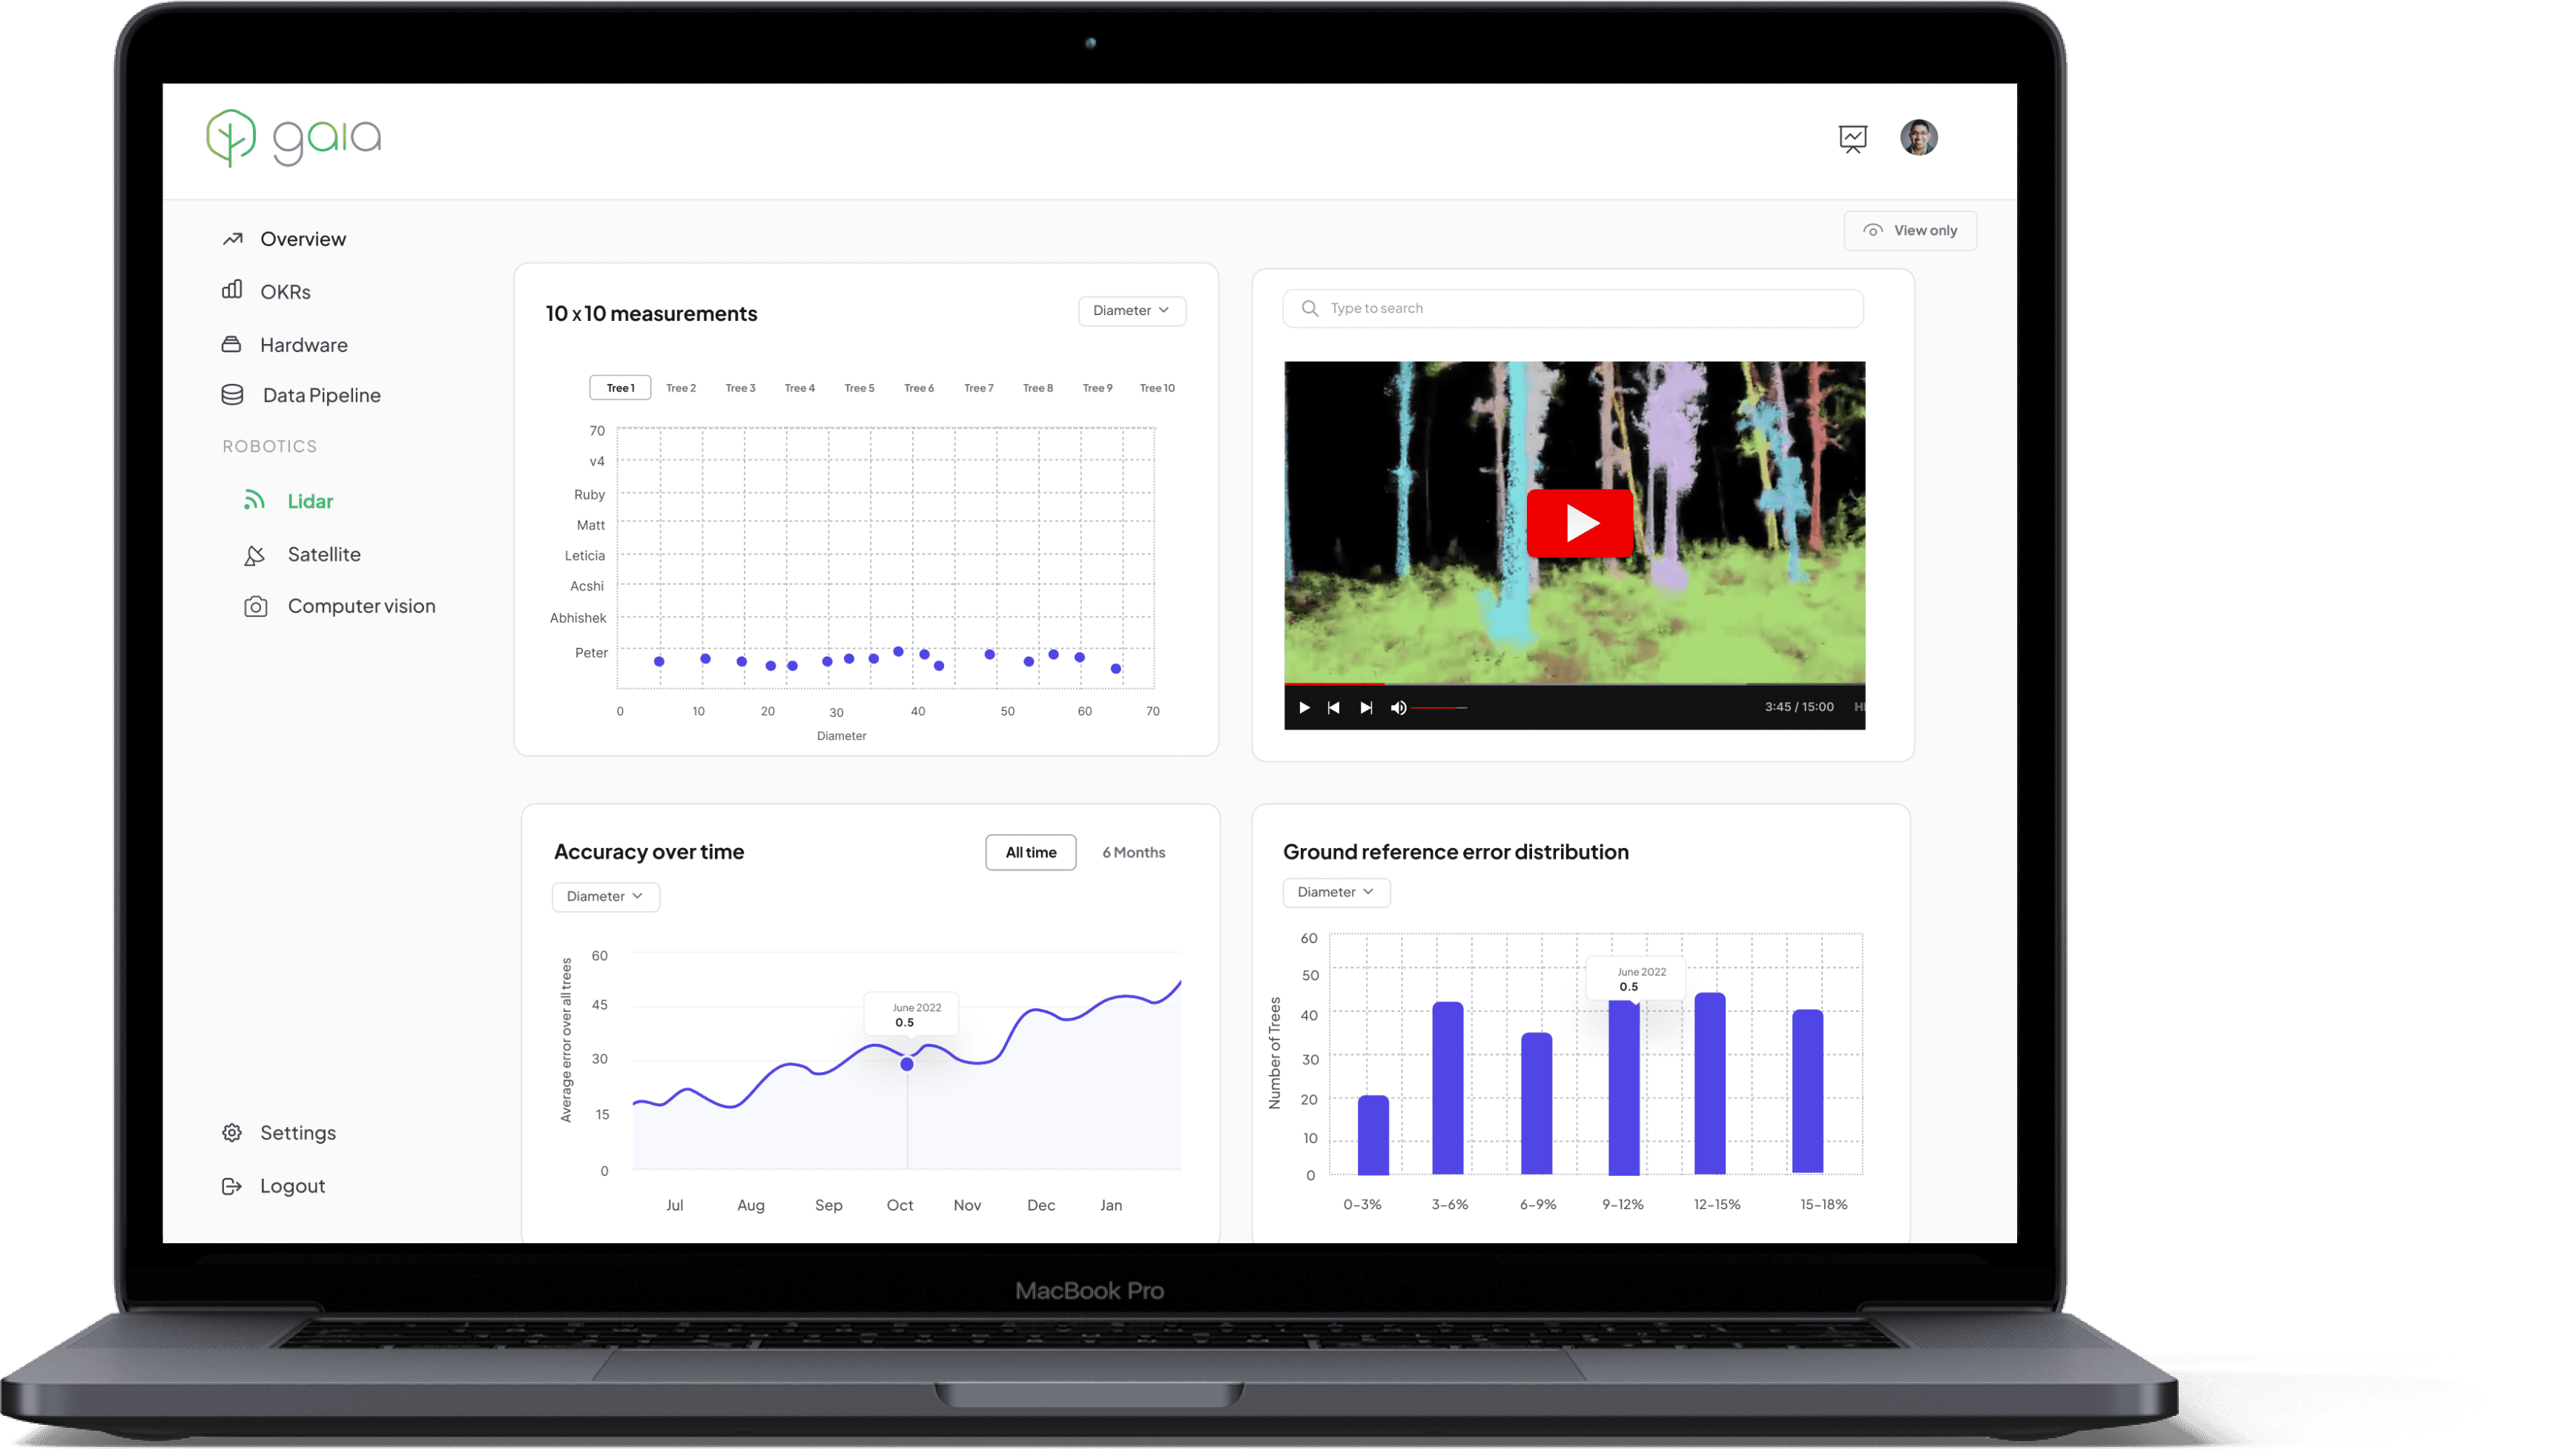
Lidar: Within the robotics team, we need to monitor the status and performance of Lidar systems, measuring accuracy at a 10x10 measurements, providing access to the latest Lidar video for real-time checks, displaying a graph illustrating system accuracy over time, and visualizing ground reference error distribution derived from manual tree data collection.
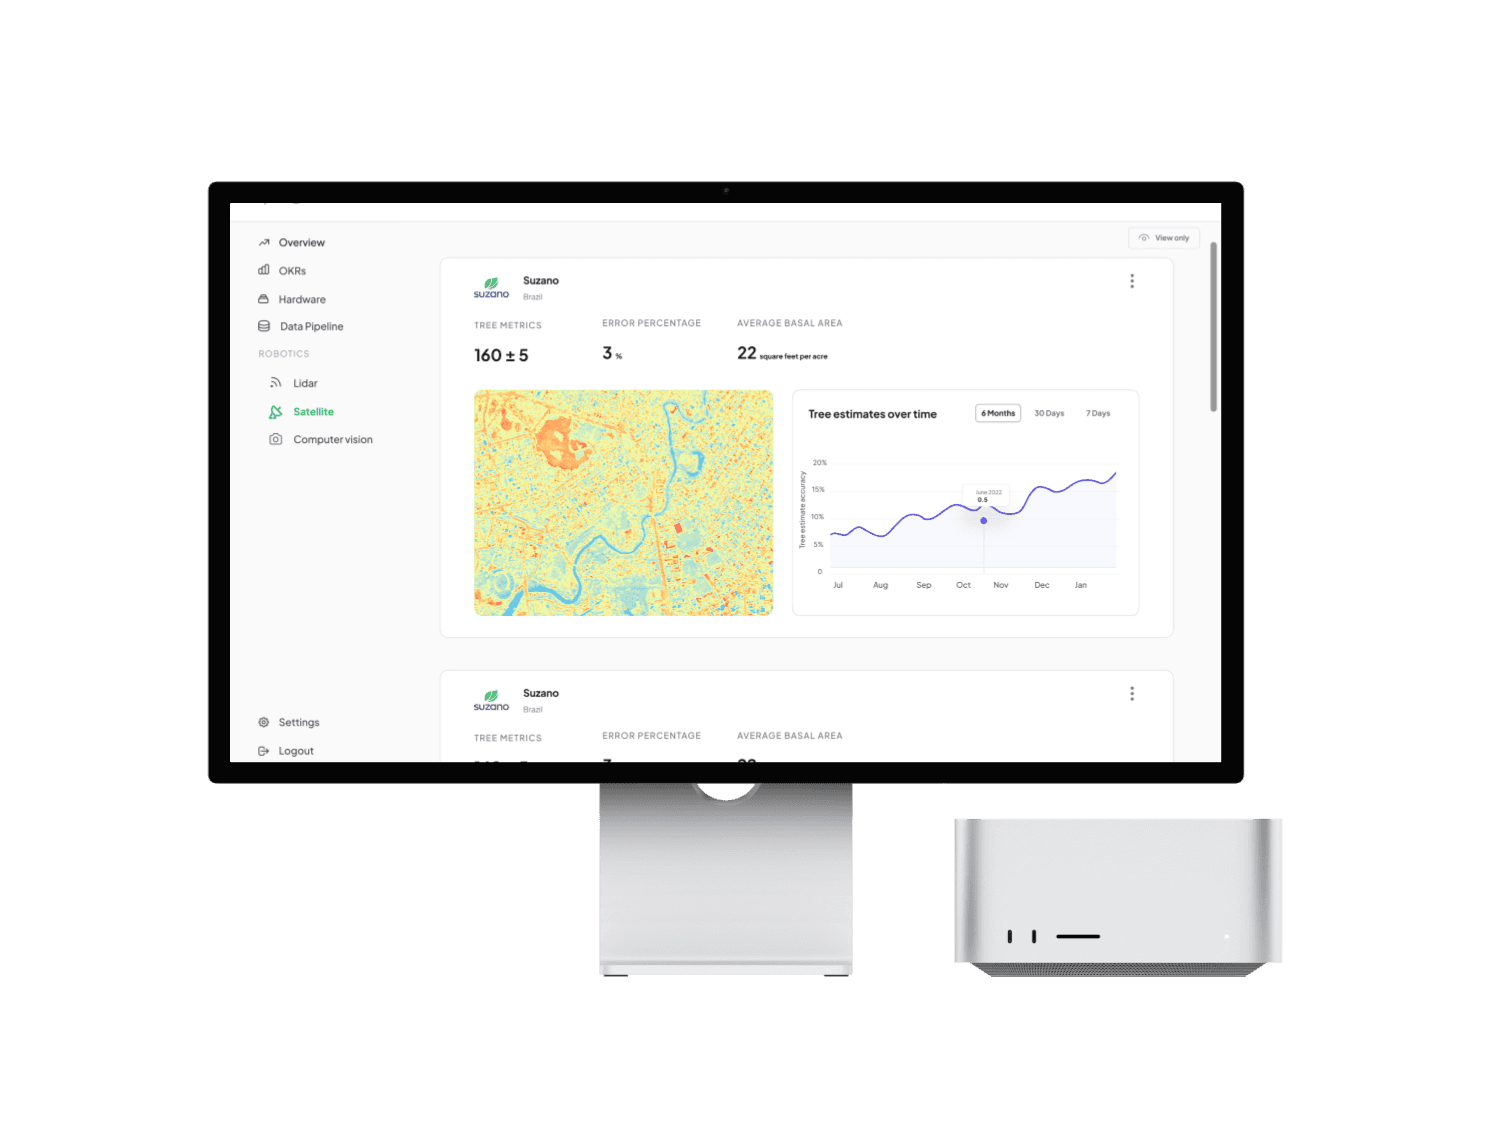
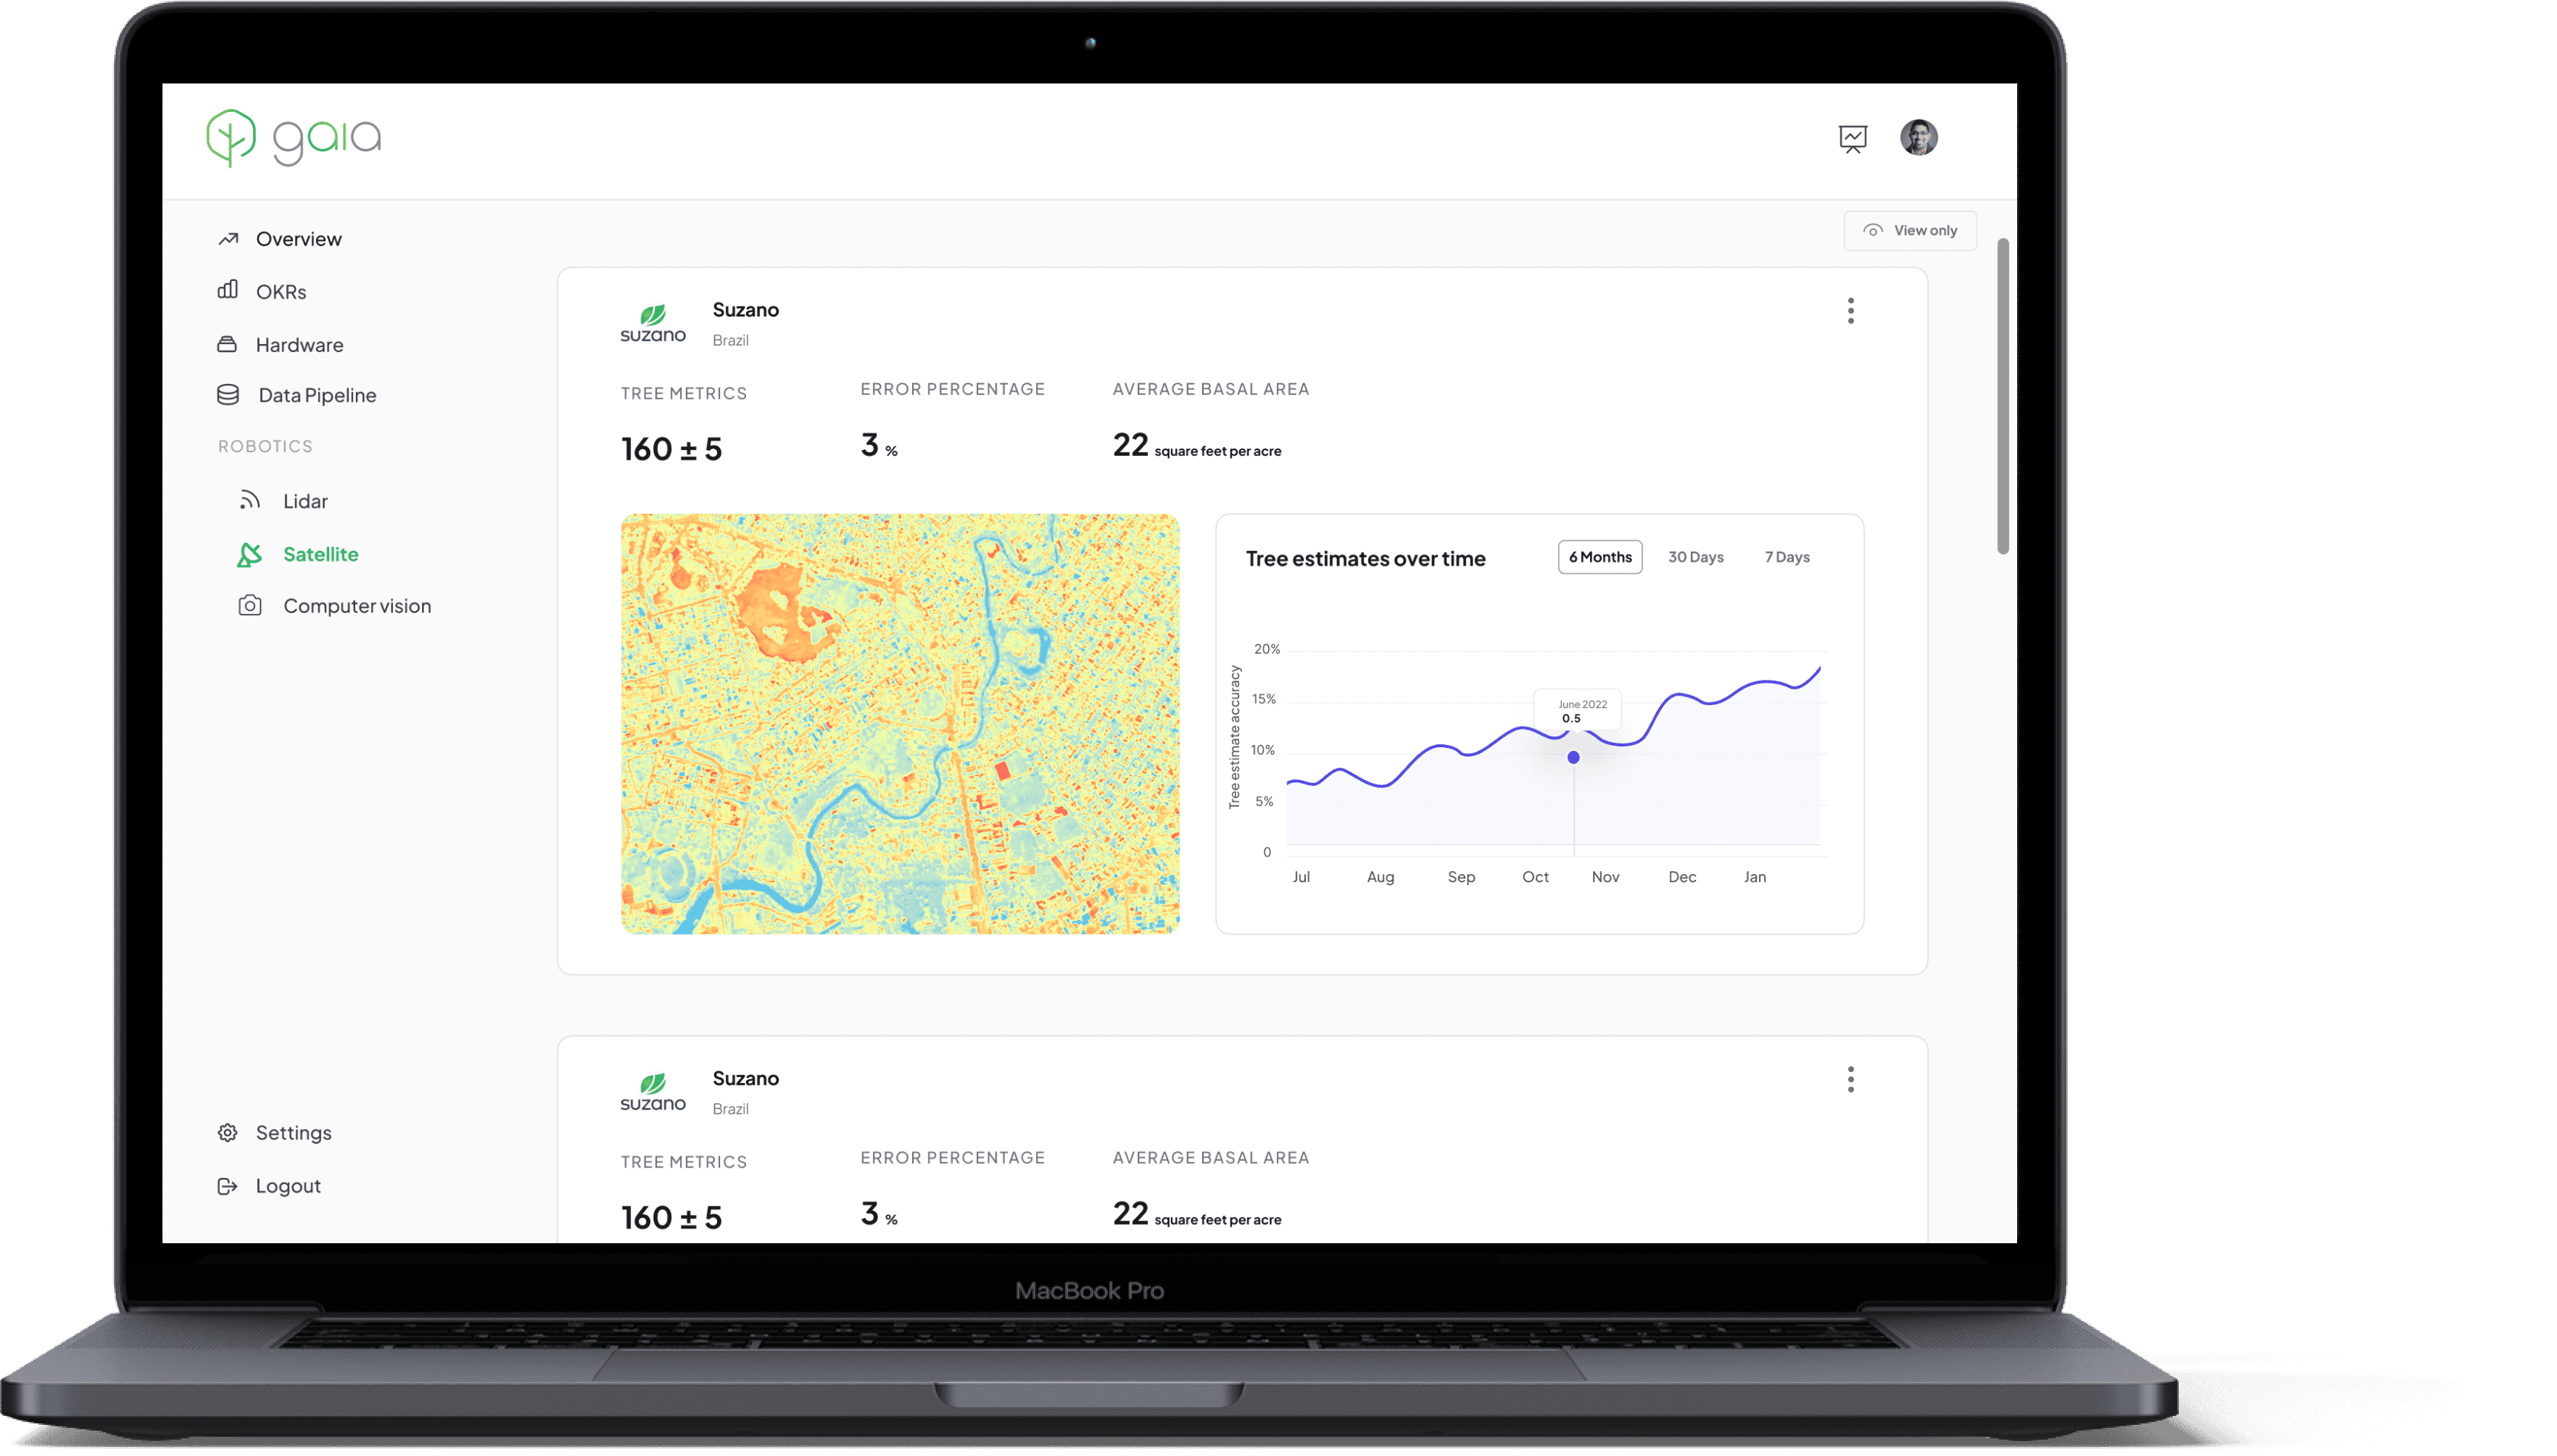
Satellite: Following the Lidar system monitoring, the robotics team also focused on assessing satellite images at a project level. This involved including heat maps with metrics such as tree characteristics, error percentages, and average basal area, alongside graphs with tree estimates over time
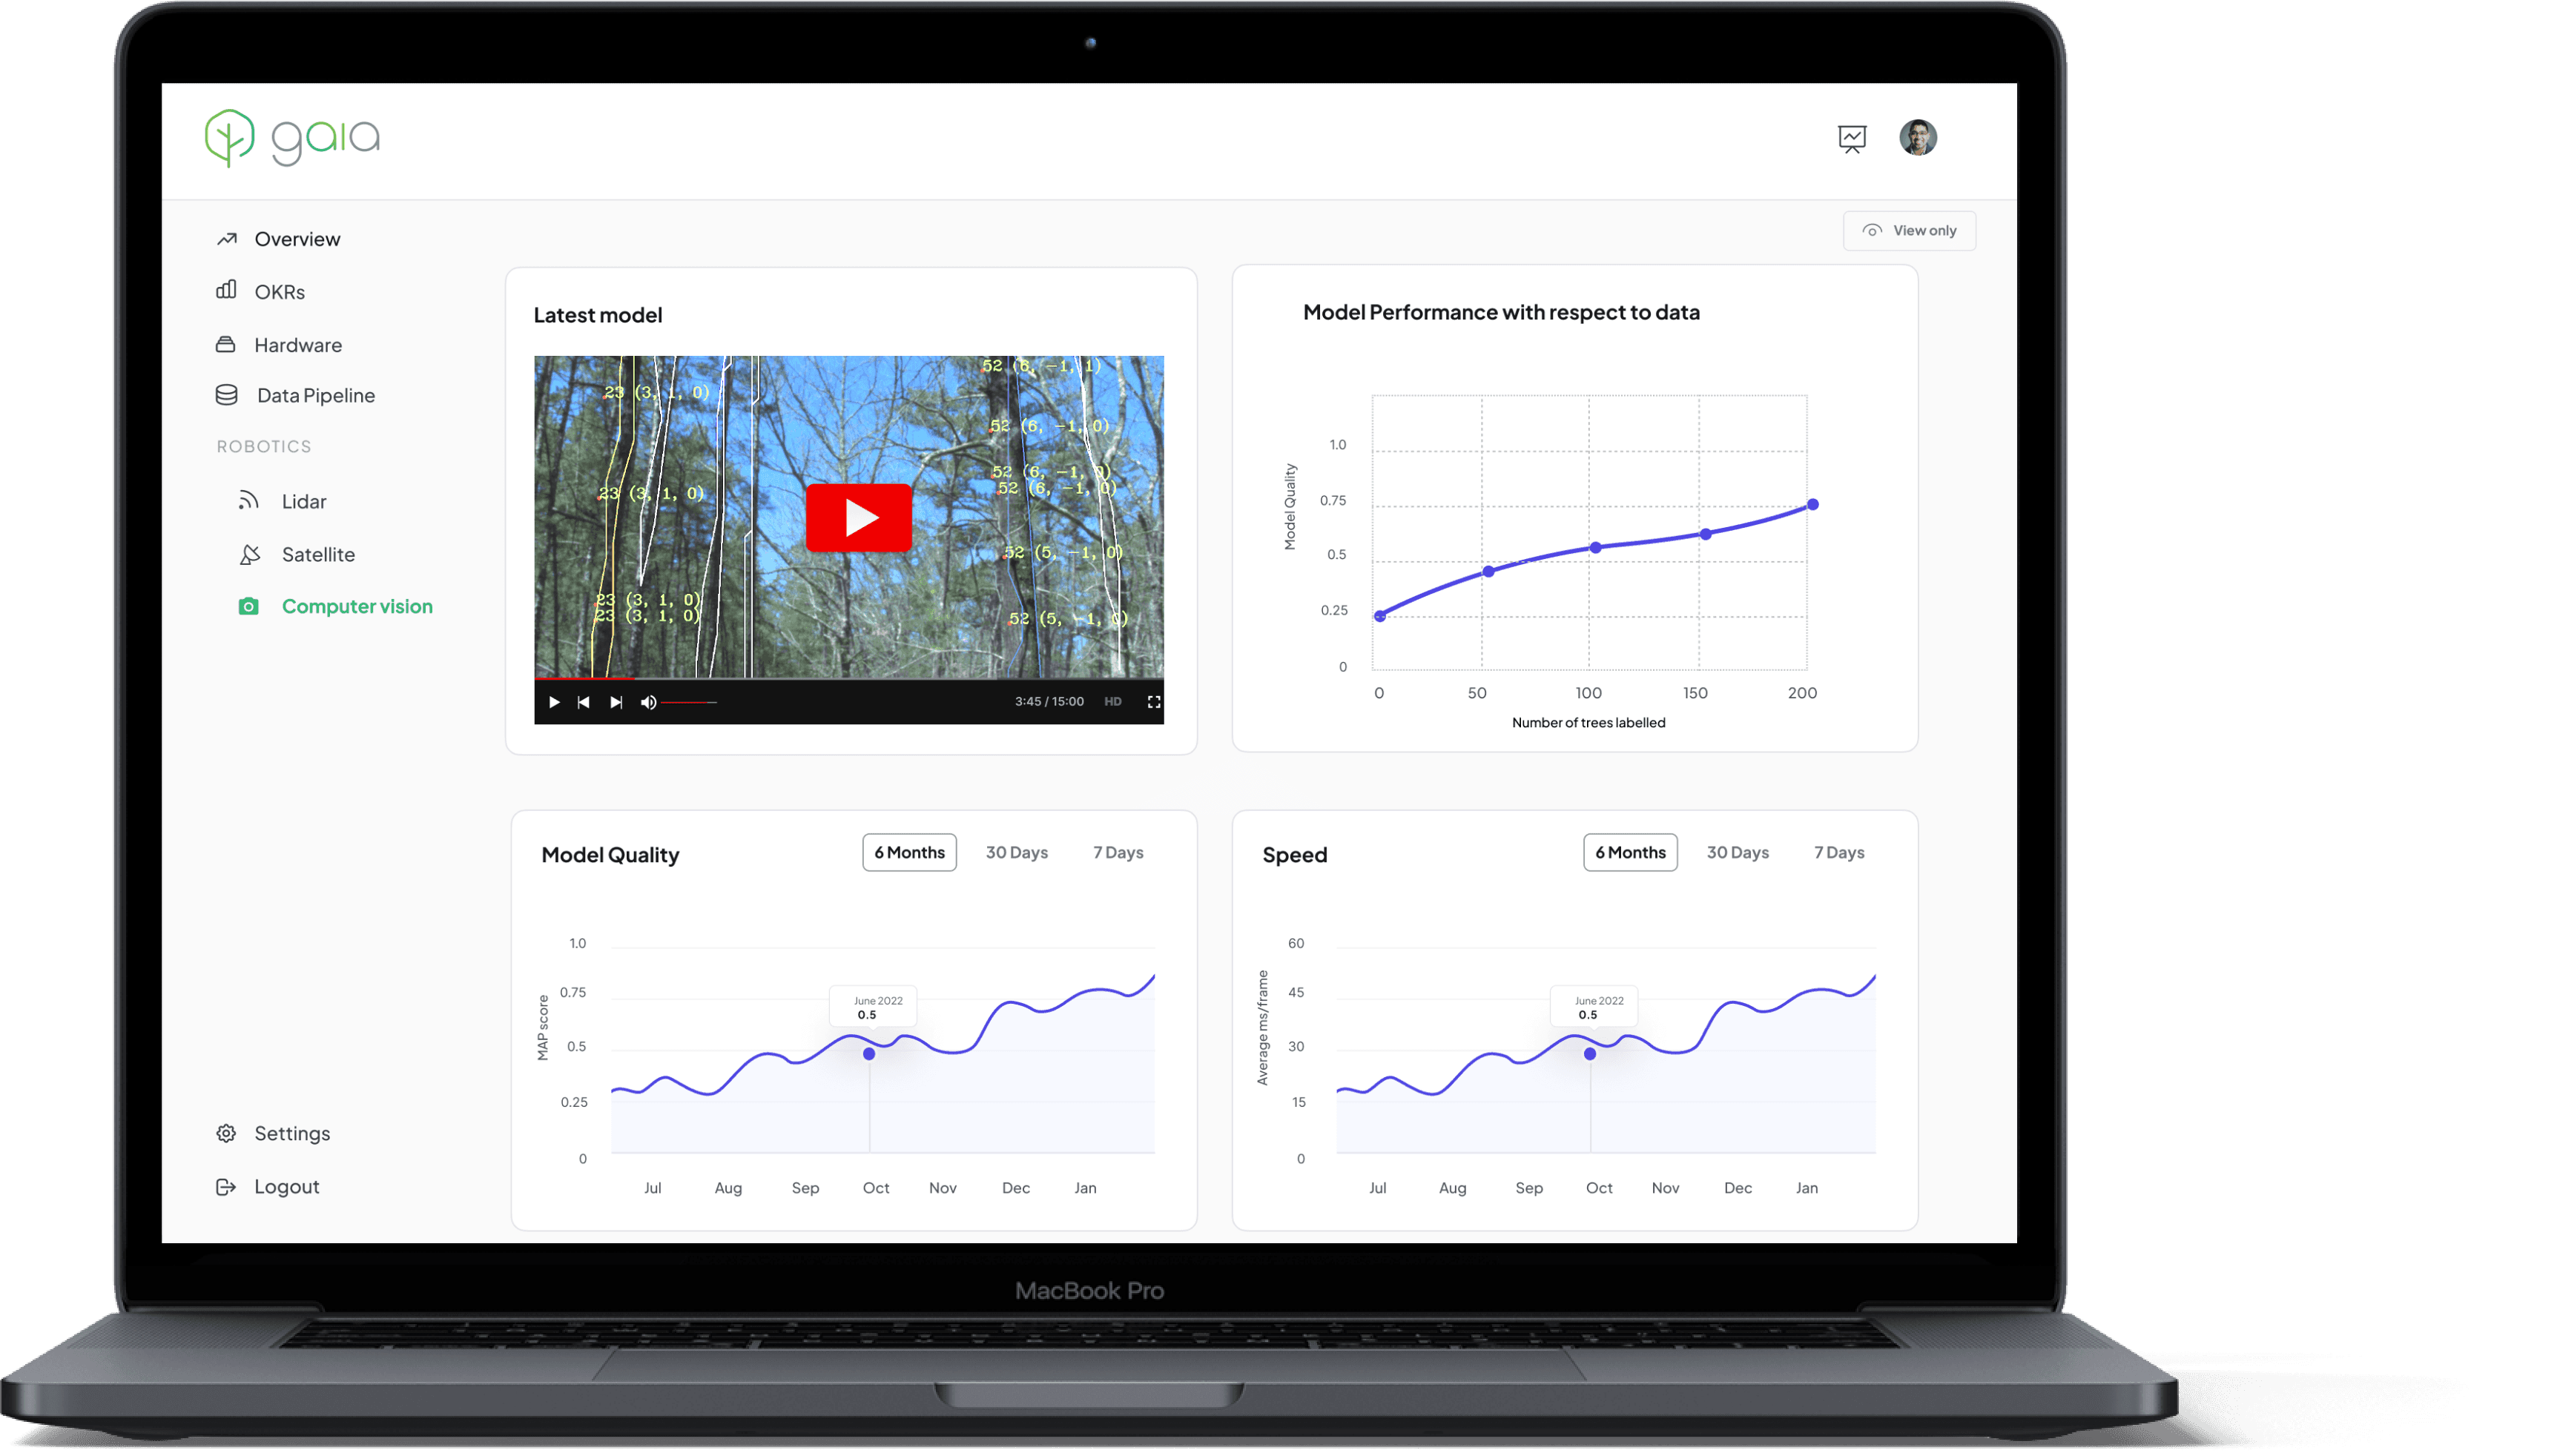
Computer Vision: The computer vision team aimed to monitor model performance concerning data, model quality, and speed. Additionally, they sought access to the latest model video for ongoing assessment
Conclusion
By developing and implementing an internal dashboard, Gaia successfully addresses the challenges associated with its fast-paced startup environment. The dashboard enables Gaia to streamline operations, enhance collaboration, and make data-driven decisions, positioning the company for continued growth and success in the competitive tech industry.